

Question: Error Measures Assignment The following data is the same as the data for the Time Series assignment. Use the spreadsheet you set up for that
Error Measures Assignment
The following data is the same as the data for the Time Series assignment. Use the spreadsheet you set up for that assignment and for each assignment calculate the Mean Error (ME), Mean Absolute Deviation (MAD), Mean Percent Error (MPE) and Mean Absolute Percent Error (MAPE). Use those four measures to select one forecasting model as the best and give the forecast for the next (11th) period.
| Period | 1 | 2 | 3 | 4 | 5 | 6 | 7 | 8 | 9 | 10 |
| Actual | 974 | 766 | 727 | 849 | 693 | 655 | 854 | 742 | 717 | 852 |
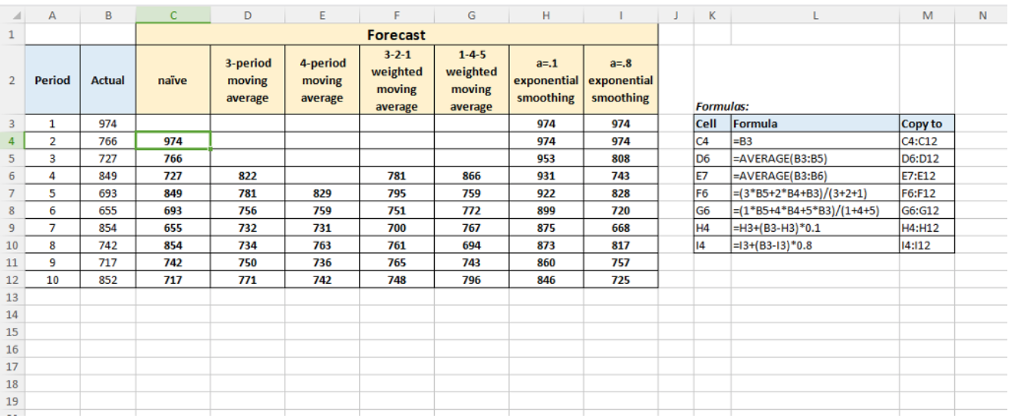
Forecast 1-4-5 3-2-1 moving moving average 3-period4-period a-.8 weighted weightedexponential exponential smoothing smoothing 2 Period Actual average average Formulas: Cell Formula C4 B3 D6 FAVERAGE(B3:B5 E7 -AVERAGE( B3:B6 F6 aver 974 766 727 849 693 655 974 974 953 931 974 974 C4:C12 D6:D12 E7:612 F6:F12 974 727 849 693 655 854 742 781 743 781 759 3.B5+2"B4+83)/(3+2+1) 759 731 763 736 742 751 720 732 734 875 873 H4:H12 4:112 767 H4 H3+(B3-H3) *0.1 10 761 765 748 817 757 725 742 13+(B3-13) *0.8 743 796 852 12 13 14 10 846 16 17 19
Step by Step Solution
There are 3 Steps involved in it

Get step-by-step solutions from verified subject matter experts