

Question: Calculate the dollar and duration gapBased on findings in the two points above, what are your expectations for future performance (not detailed financial projections? just
Calculate the dollar and duration gapBased on findings in the two points above, what are your expectations for future performance (not detailed financial projections? just your assessment as to whether the bank is expected to grow or decline, or be taken over by another bank)
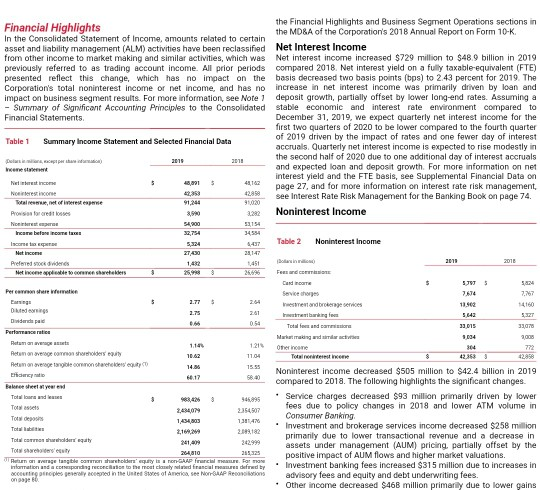
Financial Highlights In the Consolidated Statement of Income, amounts related to certain asset and liability management (ALM) activities have been reclassified from other income to market making and similar activities, which was previously referred to as trading account income. All prior periods presented reflect this change, which has no impact on the Corporation's total noninterest income or net income, and has no impact on business segment results. For more information, see Note 1 - Summary of Significant Accounting Principles to the Consolidated Financial Statements. Table 1 Summary Income Statement and Selected Financial Data cpp) Income statement Net interestin Ninterest inco Totalrent of interest exper Provision for creat losses Nonirboreat euporne Income before income tax Income tax exper Net Incom Preferred stock dividends Net income applicable to come sharehekers Per common shere information Earnings Diktedings Dividend pa Performance ratio Retaman average assets Reta on average common shareholders equity Return on average tangible common shareholders' equity ( Efficiency natio Balonce sheet a year end Total loan and Total s Total deposits Total Babies $ 3 5 $ 48,891 $ 42,353 91,244 3,990 54,900 32,754 5,324 27,430 1,432 25,999 3 1.77 $ 2.75 1.14% 10.62 14.56 66.17 2,434,079 1,434,803 2,169,269 3 241,409 264,810 2018 48,162 42,958 91,020 3,282 53154 34,554 4,-437 24,1-47 1,451 26,696 264 2.61 0.54 1.21% 11.04 15.55 56:40 946,895 2.354,907 1,381,476 2.099,182 Total common shareholders equity Total shareholder sty 242,999 26,325 Return on average tangible common shareholders' equity is a non-GAAP francial measure. For more information and a componding reconciliation to the most closely related financial measures defined by accounting principles generally accepted in the United States of America, see Non-GAAP Reconciliations on page the Financial Highlights and Business Segment Operations sections in the MD&A of the Corporation's 2018 Annual Report on Form 10-K. Net Interest Income Net interest income increased $729 million to $48.9 billion in 2019 compared 2018. Net interest yield on a fully taxable-equivalent (FTE) basis decreased two basis points (bps) to 2.43 percent for 2019. The increase in net interest income was primarily driven by loan and deposit growth, partially offset by lower long-end rates. Assuming a stable economic and interest rate environment compared to December 31, 2019, we expect quarterly net interest income for the first two quarters of 2020 to be lower compared to the fourth quarter of 2019 driven by the impact of rates and one fewer day of interest accruals. Quarterly net interest income is expected to rise modestly in the second half of 2020 due to one additional day of interest accruals and expected loan and deposit growth. For more information on net interest yield and the FTE basis, see Supplemental Financial Data on page 27, and for more information on interest rate risk management, see Interest Rate Risk Management for the Banking Book on page 74. Noninterest Income Table 2 Noninterest Income (B) Fees and con Service charges Investment and brokerage services Intet banking fem Total for and commissiona Markat making and Other income $ 2019 5,397 $ 7,674 13,902 5,642 33,015 1,004 304 42,363 3 2018 5824 7,767 14160 5,327 31,078 1,005 772 42,858 Totalnoninterest income Noninterest income decreased $505 million to $42.4 billion in 2019 compared to 2018. The following highlights the significant changes. * Service charges decreased $93 million primarily driven by lower fees due to policy changes in 2018 and lower ATM volume in Consumer Banking. * Investment and brokerage services income decreased $258 million primarily due to lower transactional revenue and a decrease in assets under management (AUM) pricing, partially offset by the positive impact of AUM flows and higher market valuations. Investment banking fees increased $315 million due to increases in advisory fees and equity and debt underwriting fees. Other income decreased $468 million primarily due to lower gains
Step by Step Solution
3.43 Rating (150 Votes )
There are 3 Steps involved in it
Ans Duration gap analysis indicates the potential change in a banks net interest income You can find ... View full answer

Get step-by-step solutions from verified subject matter experts