

Question: Estimate and depict using a partial equilibrium diagram the economic loss to the U.S. of the softwood lumber duties imposed on Canadian imports for the
Estimate and depict using a partial equilibrium diagram the economic loss to the U.S. of the softwood lumber duties imposed on Canadian imports for the combined years 2001-2006. Assume a price of $350/thousand board feet and total US consumption of 360 billion board feet, exactly one-third of which was imported from Canada. Why do you think this dispute has lasted 50 years?
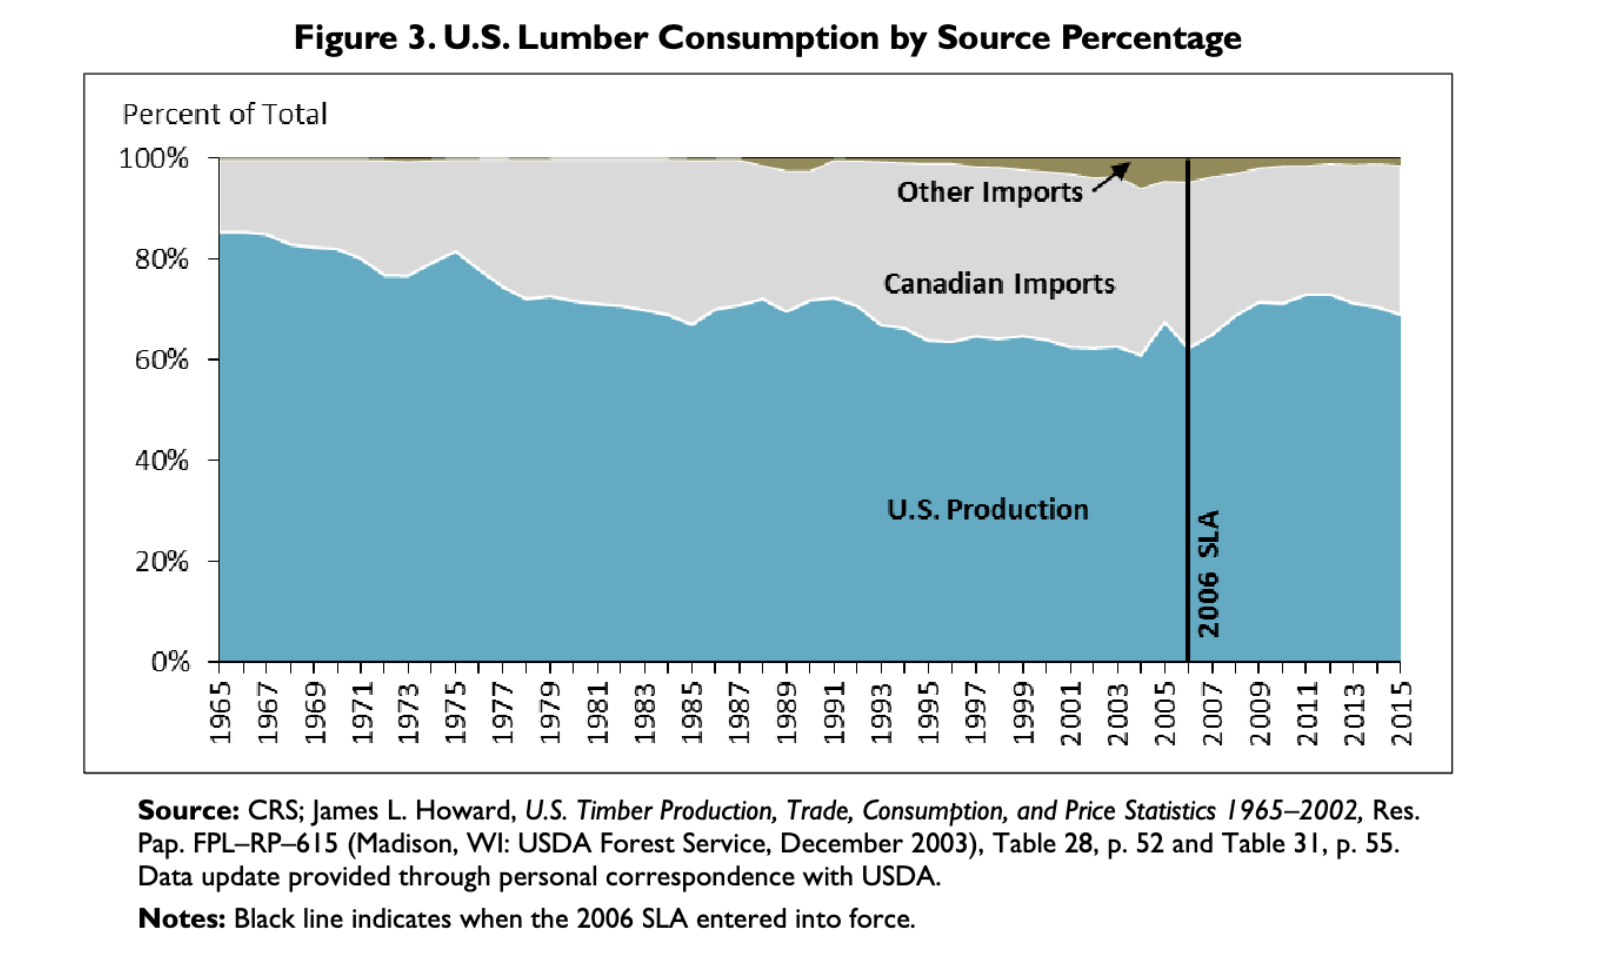
Figure 3. U.S. Lumber Consumption by Source Percentage Percent of Total 100% 80% 60% 40% 20% 960 0% Other Imports Canadian Imports 1965 1967 1969 - 1971- 1973 - 1975 - 1977 - 1979 - 1981 1983 1985- 1987 - 1989 - 1991 1993- 1995 1997 - 1999- 2001 2003 2005 2007 2006 SLA 2009- 2011- U.S. Production 2013 2015 Source: CRS; James L. Howard, U.S. Timber Production, Trade, Consumption, and Price Statistics 1965-2002, Res. Pap. FPL-RP-615 (Madison, WI: USDA Forest Service, December 2003), Table 28, p. 52 and Table 31, p. 55. Data update provided through personal correspondence with USDA. Notes: Black line indicates when the 2006 SLA entered into force.
Step by Step Solution
There are 3 Steps involved in it

Get step-by-step solutions from verified subject matter experts