Question: Estimate Portfolio Risk Measures Using Different Returns Distributions. Consider the log- return stock price model on Slide 20 of the Generating Continuous Random Variables lecture
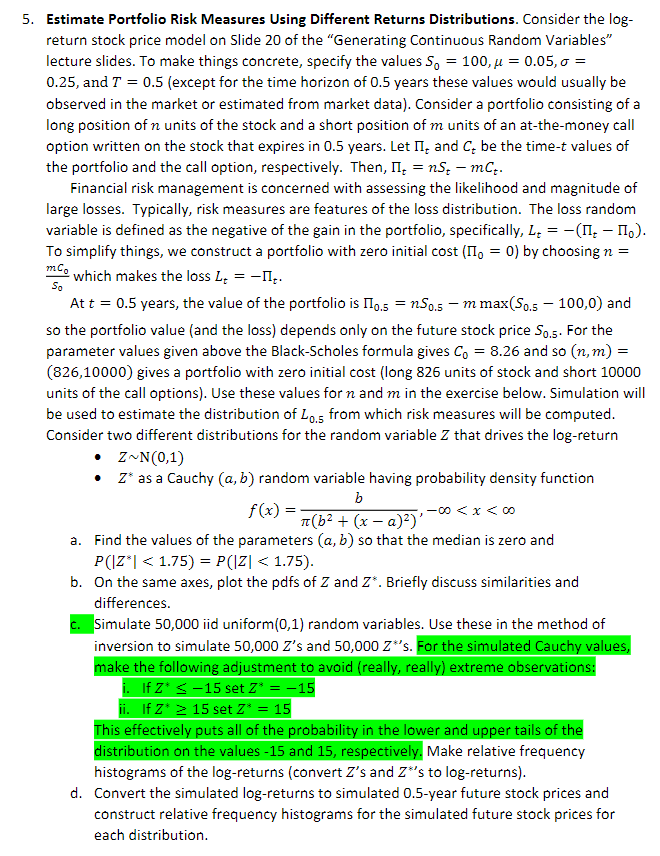
Estimate Portfolio Risk Measures Using Different Returns Distributions. Consider the log- return stock price model on Slide 20 of the "Generating Continuous Random Variables" lecture slides. To make things concrete, specify the values So = 100,u = 0.05,0 = 0.25, and T = 0.5 (except for the time horizon of 0.5 years these values would usually be observed in the market or estimated from market data). Consider a portfolio consisting of a long position of n units of the stock and a short position of m units of an at-the-money call option written on the stock that expires in 0.5 years. Let II, and C be the time-t values of the portfolio and the call option, respectively. Then, II, = nS - mC. Financial risk management is concerned with assessing the likelihood and magnitude of large losses. Typically, risk measures are features of the loss distribution. The loss random variable is defined as the negative of the gain in the portfolio, specifically, L= -(I-.). To simplify things, we construct a portfolio with zero initial cost (IIo = 0) by choosing n = which makes the loss Lt = -0. At t = 0.5 years, the value of the portfolio is no.5 = n50.5 - m max(50.5 100,0) and so the portfolio value and the loss) depends only on the future stock price $0.5. For the parameter values given above the Black-Scholes formula gives Co = 8.26 and so (n, m) = (826,10000) gives a portfolio with zero initial cost (long 826 units of stock and short 10000 units of the call options). Use these values for n and m in the exercise below. Simulation will be used to estimate the distribution of Los from which risk measures will be computed. Consider two different distributions for the random variable Z that drives the log-return Z N(0,1) Z* as a Cauchy (a, b) random variable having probability density function b (52 + (x - 2)2):-00 15 set z* = 15 This effectively puts all of the probability in the lower and upper tails of the distribution on the values -15 and 15, respectively. Make relative frequency histograms of the log-returns (convert Z's and Z*'s to log-returns). d. Convert the simulated log-returns to simulated 0.5-year future stock prices and construct relative frequency histograms for the simulated future stock prices for each distribution. Estimate Portfolio Risk Measures Using Different Returns Distributions. Consider the log- return stock price model on Slide 20 of the "Generating Continuous Random Variables" lecture slides. To make things concrete, specify the values So = 100,u = 0.05,0 = 0.25, and T = 0.5 (except for the time horizon of 0.5 years these values would usually be observed in the market or estimated from market data). Consider a portfolio consisting of a long position of n units of the stock and a short position of m units of an at-the-money call option written on the stock that expires in 0.5 years. Let II, and C be the time-t values of the portfolio and the call option, respectively. Then, II, = nS - mC. Financial risk management is concerned with assessing the likelihood and magnitude of large losses. Typically, risk measures are features of the loss distribution. The loss random variable is defined as the negative of the gain in the portfolio, specifically, L= -(I-.). To simplify things, we construct a portfolio with zero initial cost (IIo = 0) by choosing n = which makes the loss Lt = -0. At t = 0.5 years, the value of the portfolio is no.5 = n50.5 - m max(50.5 100,0) and so the portfolio value and the loss) depends only on the future stock price $0.5. For the parameter values given above the Black-Scholes formula gives Co = 8.26 and so (n, m) = (826,10000) gives a portfolio with zero initial cost (long 826 units of stock and short 10000 units of the call options). Use these values for n and m in the exercise below. Simulation will be used to estimate the distribution of Los from which risk measures will be computed. Consider two different distributions for the random variable Z that drives the log-return Z N(0,1) Z* as a Cauchy (a, b) random variable having probability density function b (52 + (x - 2)2):-00 15 set z* = 15 This effectively puts all of the probability in the lower and upper tails of the distribution on the values -15 and 15, respectively. Make relative frequency histograms of the log-returns (convert Z's and Z*'s to log-returns). d. Convert the simulated log-returns to simulated 0.5-year future stock prices and construct relative frequency histograms for the simulated future stock prices for each distribution


