

Question: Estimate the Enterprise Value using a mutiples approach Determine the Discounted Cash Flow using the APV method, Exhibit 5 Recent Deals/Transaction Multiples (All in million
Estimate the Enterprise Value using a mutiples approach
Determine the Discounted Cash Flow using the APV method, 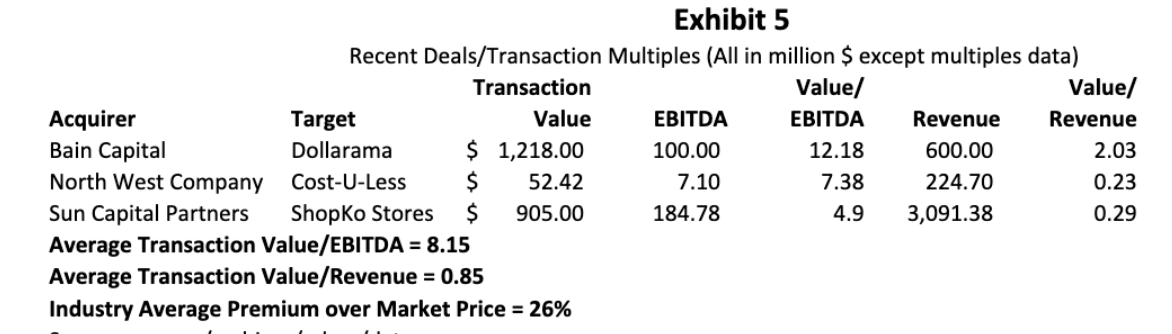
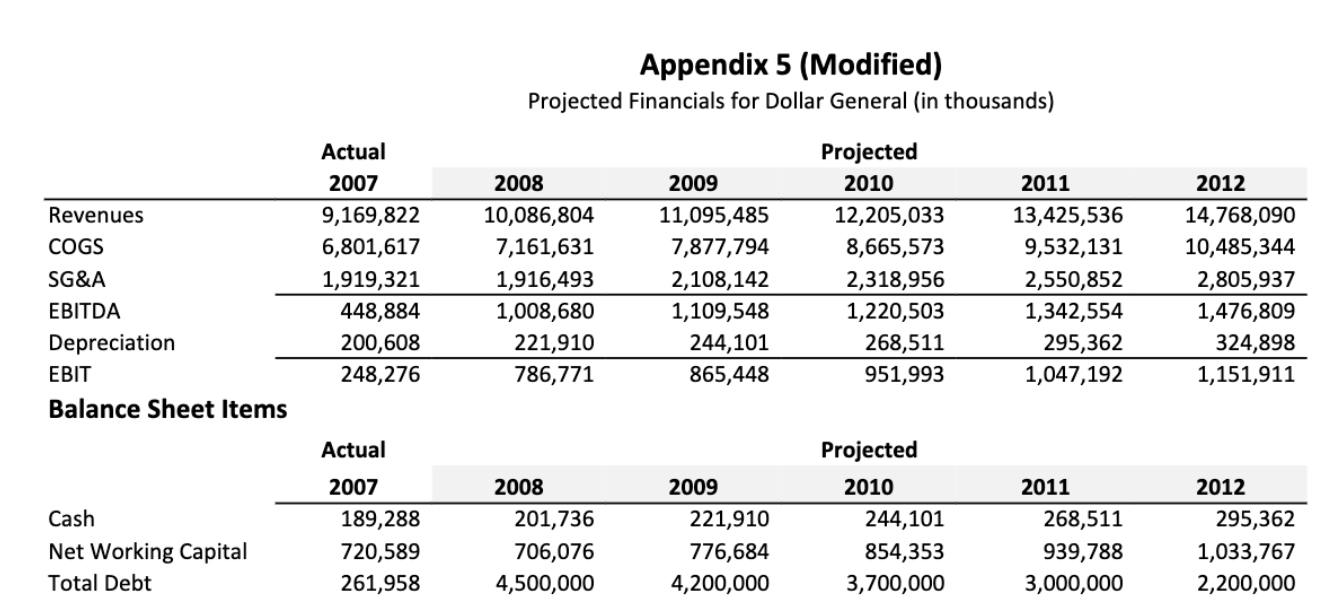
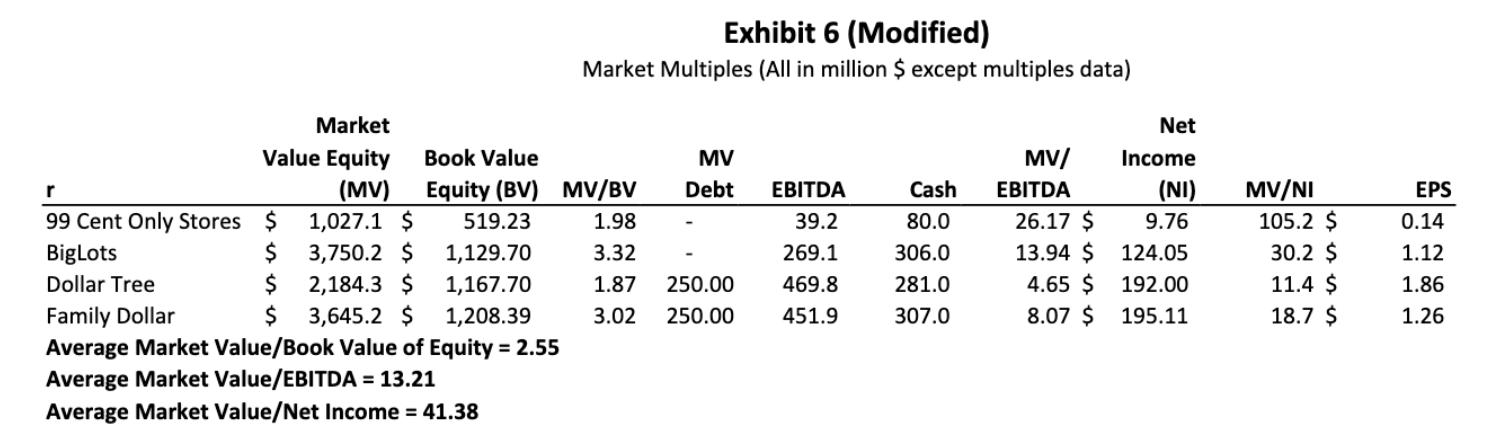
Exhibit 5 Recent Deals/Transaction Multiples (All in million $ except multiples data) Transaction Value/ Value) Acquirer Target Value EBITDA EBITDA Revenue Revenue Bain Capital Dollarama $ 1,218.00 100.00 12.18 600.00 2.03 North West Company Cost-U-Less $ 52.42 7.10 7.38 224.70 0.23 Sun Capital Partners Shopko Stores $ 905.00 184.78 4.9 3,091.38 0.29 Average Transaction Value/EBITDA = 8.15 Average Transaction Value/Revenue = 0.85 Industry Average Premium over Market Price = 26% Appendix 5 (Modified) Projected Financials for Dollar General (in thousands) Revenues COGS SG&A EBITDA Depreciation EBIT Balance Sheet Items Actual 2007 9,169,822 6,801,617 1,919,321 448,884 200,608 248,276 2008 10,086,804 7,161,631 1,916,493 1,008,680 221,910 786,771 2009 11,095,485 7,877,794 2,108,142 1,109,548 244,101 865,448 Projected 2010 12,205,033 8,665,573 2,318,956 1,220,503 268,511 951,993 2011 13,425,536 9,532,131 2,550,852 1,342,554 295,362 1,047,192 2012 14,768,090 10,485,344 2,805,937 1,476,809 324,898 1,151,911 Cash Net Working Capital Total Debt Actual 2007 189,288 720,589 261,958 2008 201,736 706,076 4,500,000 2009 221,910 776,684 4,200,000 Projected 2010 244,101 854,353 3,700,000 2011 268,511 939,788 3,000,000 2012 295,362 1,033,767 2,200,000 Exhibit 6 (Modified) Market Multiples (All in million $ except multiples data) MV/ MV Debt - Market Value Equity Book Value (MV) Equity (BV) MV/BV 99 Cent Only Stores $ 1,027.1 $ 519.23 1.98 BigLots $ 3,750.2 $ 1,129.70 3.32 Dollar Tree $ 2,184.3 $ 1,167.70 1 .87 Family Dollar $ 3,645.2 $ 1,208.39 3.02 Average Market Value/Book Value of Equity = 2.55 Average Market Value/EBITDA = 13.21 Average Market Value/Net Income = 41.38 EBITDA 39.2 269.1 469.8 451. 9 Cash 80.0 306.0 281.0 3 07.0 EBITDA 26.17 $ 13.94 $ 4.65 $ 8.07 $ Net Income (NI) 9.76 124.05 192.00 195.11 MV/NI 105.2 $ 30.2 $ 11.4 $ 18.7 $ EPS 0.14 1.12 1.86 1.26 250.00 250.00 Exhibit 5 Recent Deals/Transaction Multiples (All in million $ except multiples data) Transaction Value/ Value) Acquirer Target Value EBITDA EBITDA Revenue Revenue Bain Capital Dollarama $ 1,218.00 100.00 12.18 600.00 2.03 North West Company Cost-U-Less $ 52.42 7.10 7.38 224.70 0.23 Sun Capital Partners Shopko Stores $ 905.00 184.78 4.9 3,091.38 0.29 Average Transaction Value/EBITDA = 8.15 Average Transaction Value/Revenue = 0.85 Industry Average Premium over Market Price = 26% Appendix 5 (Modified) Projected Financials for Dollar General (in thousands) Revenues COGS SG&A EBITDA Depreciation EBIT Balance Sheet Items Actual 2007 9,169,822 6,801,617 1,919,321 448,884 200,608 248,276 2008 10,086,804 7,161,631 1,916,493 1,008,680 221,910 786,771 2009 11,095,485 7,877,794 2,108,142 1,109,548 244,101 865,448 Projected 2010 12,205,033 8,665,573 2,318,956 1,220,503 268,511 951,993 2011 13,425,536 9,532,131 2,550,852 1,342,554 295,362 1,047,192 2012 14,768,090 10,485,344 2,805,937 1,476,809 324,898 1,151,911 Cash Net Working Capital Total Debt Actual 2007 189,288 720,589 261,958 2008 201,736 706,076 4,500,000 2009 221,910 776,684 4,200,000 Projected 2010 244,101 854,353 3,700,000 2011 268,511 939,788 3,000,000 2012 295,362 1,033,767 2,200,000 Exhibit 6 (Modified) Market Multiples (All in million $ except multiples data) MV/ MV Debt - Market Value Equity Book Value (MV) Equity (BV) MV/BV 99 Cent Only Stores $ 1,027.1 $ 519.23 1.98 BigLots $ 3,750.2 $ 1,129.70 3.32 Dollar Tree $ 2,184.3 $ 1,167.70 1 .87 Family Dollar $ 3,645.2 $ 1,208.39 3.02 Average Market Value/Book Value of Equity = 2.55 Average Market Value/EBITDA = 13.21 Average Market Value/Net Income = 41.38 EBITDA 39.2 269.1 469.8 451. 9 Cash 80.0 306.0 281.0 3 07.0 EBITDA 26.17 $ 13.94 $ 4.65 $ 8.07 $ Net Income (NI) 9.76 124.05 192.00 195.11 MV/NI 105.2 $ 30.2 $ 11.4 $ 18.7 $ EPS 0.14 1.12 1.86 1.26 250.00 250.00
Step by Step Solution
There are 3 Steps involved in it

Get step-by-step solutions from verified subject matter experts