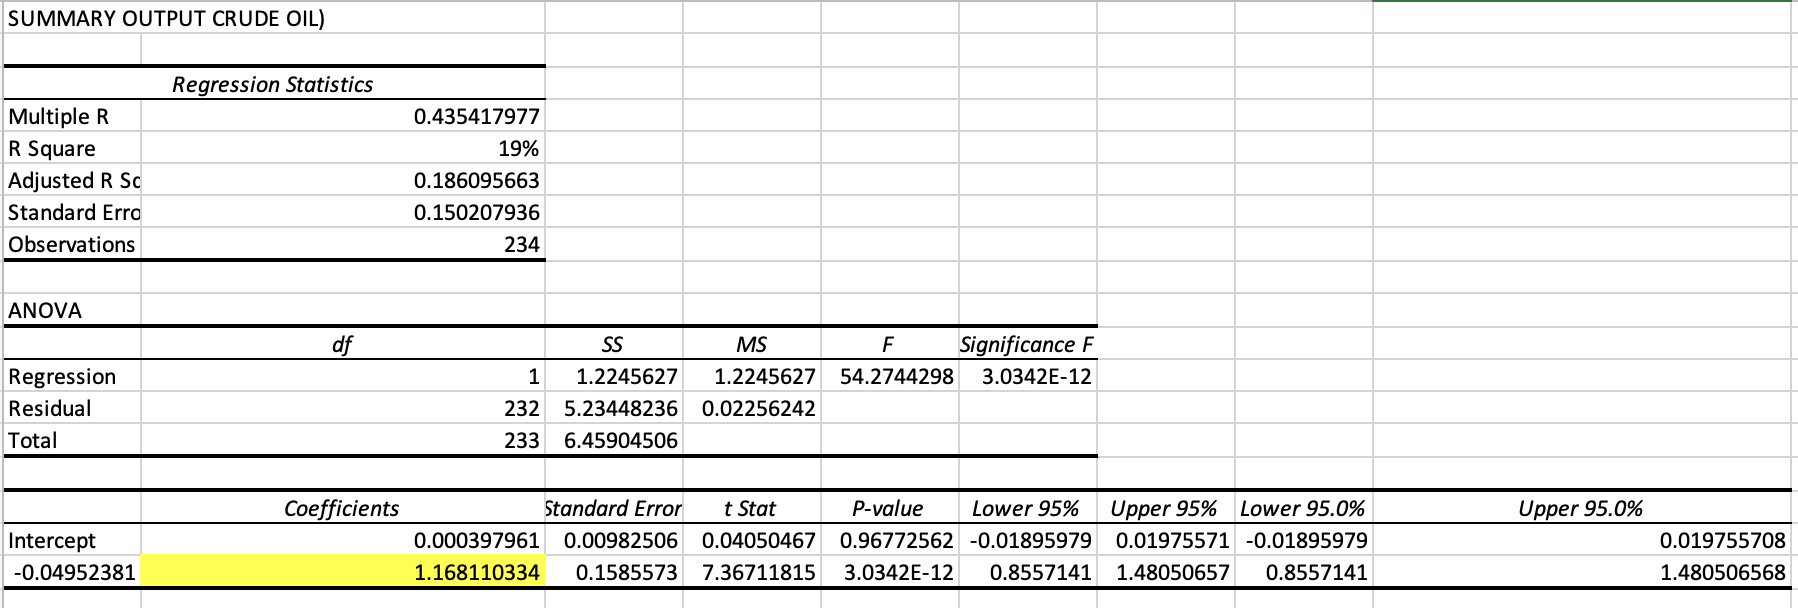
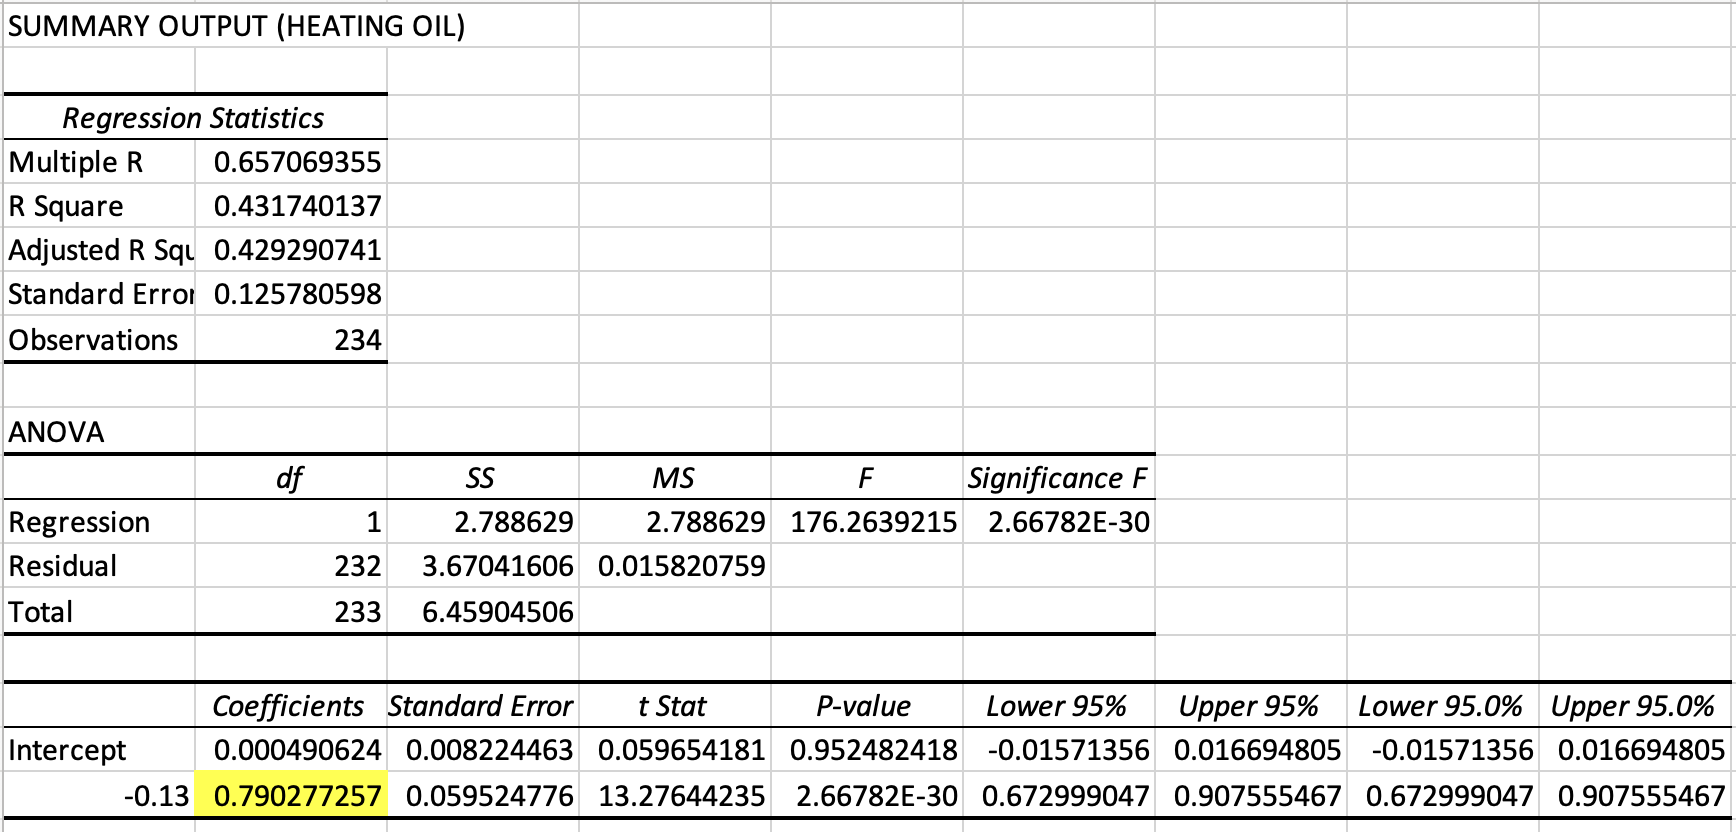
Question: Estimate the optimal hedge ratio using regression analysis using close price data from the beginning of the sample period until July 5, 2024. Use price

  1. Estimate the optimal hedge ratio using regression analysis using close price data from the beginning of the sample period until July 5, 2024. Use price changes in your model. Tabulate the estimated results in the report, explain them in detail, and recommend the most suitable Futures contract for hedging.
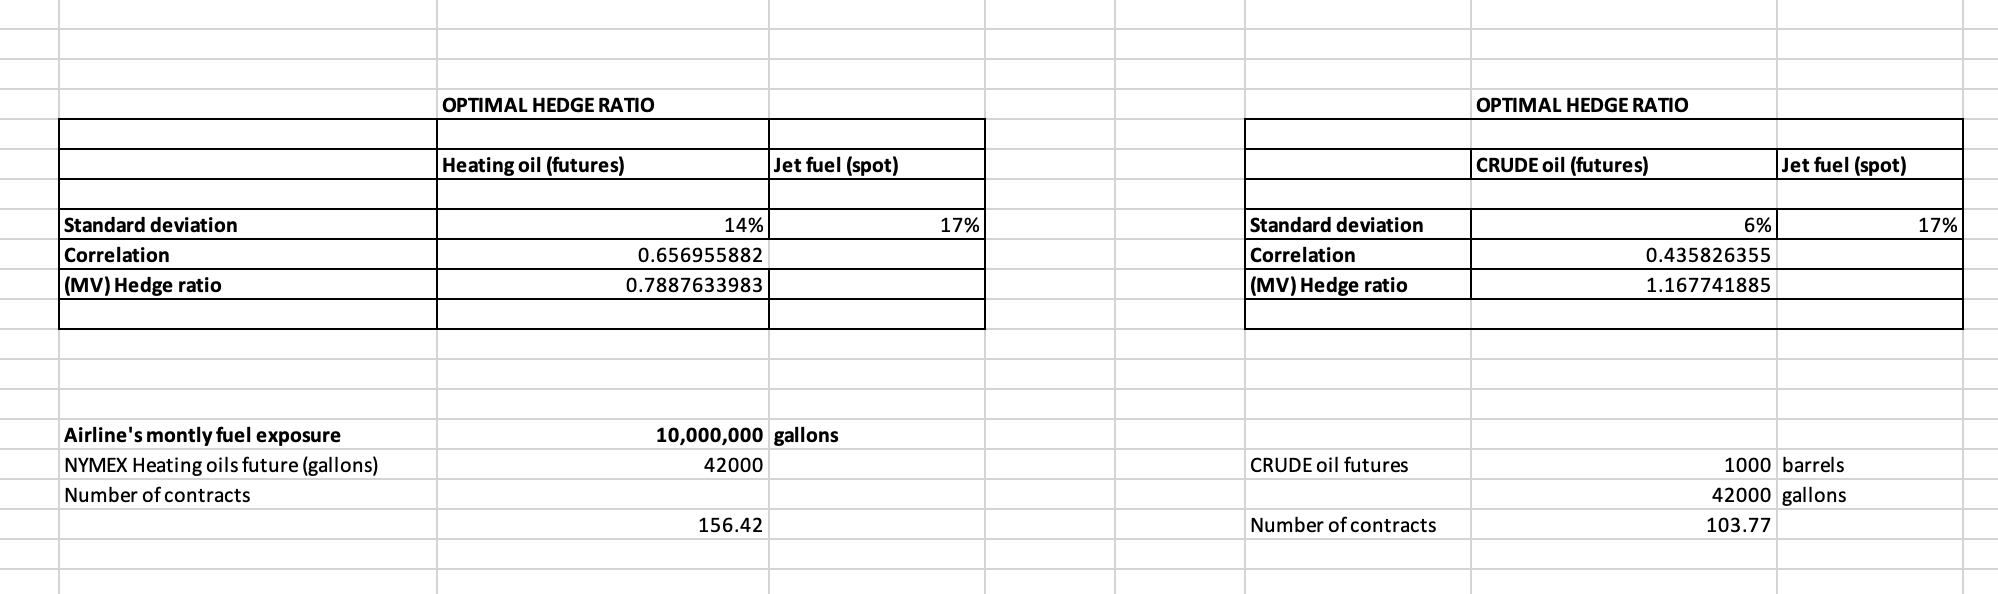
  2. The Chief Executive Officer of the medium-sized airline located in Melbourne Haris indicated that the airline's monthly fuel exposure amounts to 10 million gallons of jet fuel and asked you to implement your proposed hedging strategy from July 5, 2024, to September 27, 2024, utilizing the preferred Futures contract identified in your response to question 1. For the sake of simplicity, assume that hedging positions are established during the first week of each month and are closed out just before the expiration dates of the contracts occurring during the last week of the month. Analyse the hedging strategy during the period specified by Haris and recommend whether she should utilize futures to hedge the fuel exposure. Present the findings in tables
Estimate the optimal hedge ratio using regressionEstimate the optimal hedge ratio using regressionEstimate the optimal hedge ratio using regression
SUMMARY OUTPUT CRUDE OIL) Regression Statistics Multiple R 0.435417977 R Square 19% Adjusted R So 0.186095663 Standard Erro 0.150207936 Observations 234 ANOVA df SS MS F Significance F Regression 1 1.2245627 1.2245627 54.2744298 3.0342E-12 Residual 232 5.23448236 0.02256242 Total 233 6.45904506 Coefficients Standard Error t Stat P-value Lower 95% Upper 95% Lower 95.0% Upper 95.0% Intercept 0.000397961 0.00982506 0.04050467 0.96772562 -0.01895979 0.01975571 -0.01895979 0.019755708 -0.04952381 1.168110334 0.1585573 7.36711815 3.0342E-12 0.8557141 1.48050657 0.8557141 1.480506568SUMMARY OUTPUT (HEATING OIL) Regression Statistics Multiple R 0.657069355 R Square 0.431740137 Adjusted R Squ 0.429290741 Standard Error 0.125780598 Observations 234 ANOVA df SS MS F Significance F Regression 1 2.788629 2.788629 176.2639215 2.66782E-30 Residual 232 3.67041606 0.015820759 Total 233 6.45904506 Coefficients Standard Error t Stat P-value Lower 95% Upper 95% Lower 95.0% Upper 95.0% Intercept 0.000490624 0.008224463 0.059654181 0.952482418 -0.01571356 0.016694805 -0.01571356 0.016694805 -0.13 0.790277257 0.059524776 13.27644235 2.66782E-30 0.672999047 0.907555467 0.672999047 0.907555467OPTIMAL HEDGE RATIO Heating oil (futures) Jet fuel (spot) Standard deviation 14% 17% Correlation (MV) Hedge ratio 0.656955882 0.7887633983 Airline's montly fuel exposure NYMEX Heating oils future (gallons) Number of contracts 10,000,000 gallons 42000 156.42 OPTIMAL HEDGE RATIO CRUDE oil (futures) Jet fuel (spot) Standard deviation 6% 17% Correlation 0.435826355 (MV) Hedge ratio 1.167741885 CRUDE oil futures 1000 barrels 42000 gallons Number of contracts 103.77

Step by Step Solution

There are 3 Steps involved in it

1 Expert Approved Answer
Step: 1 Unlock blur-text-image
Question Has Been Solved by an Expert!

Get step-by-step solutions from verified subject matter experts

Step: 2 Unlock
Step: 3 Unlock

Students Have Also Explored These Related Finance Questions!