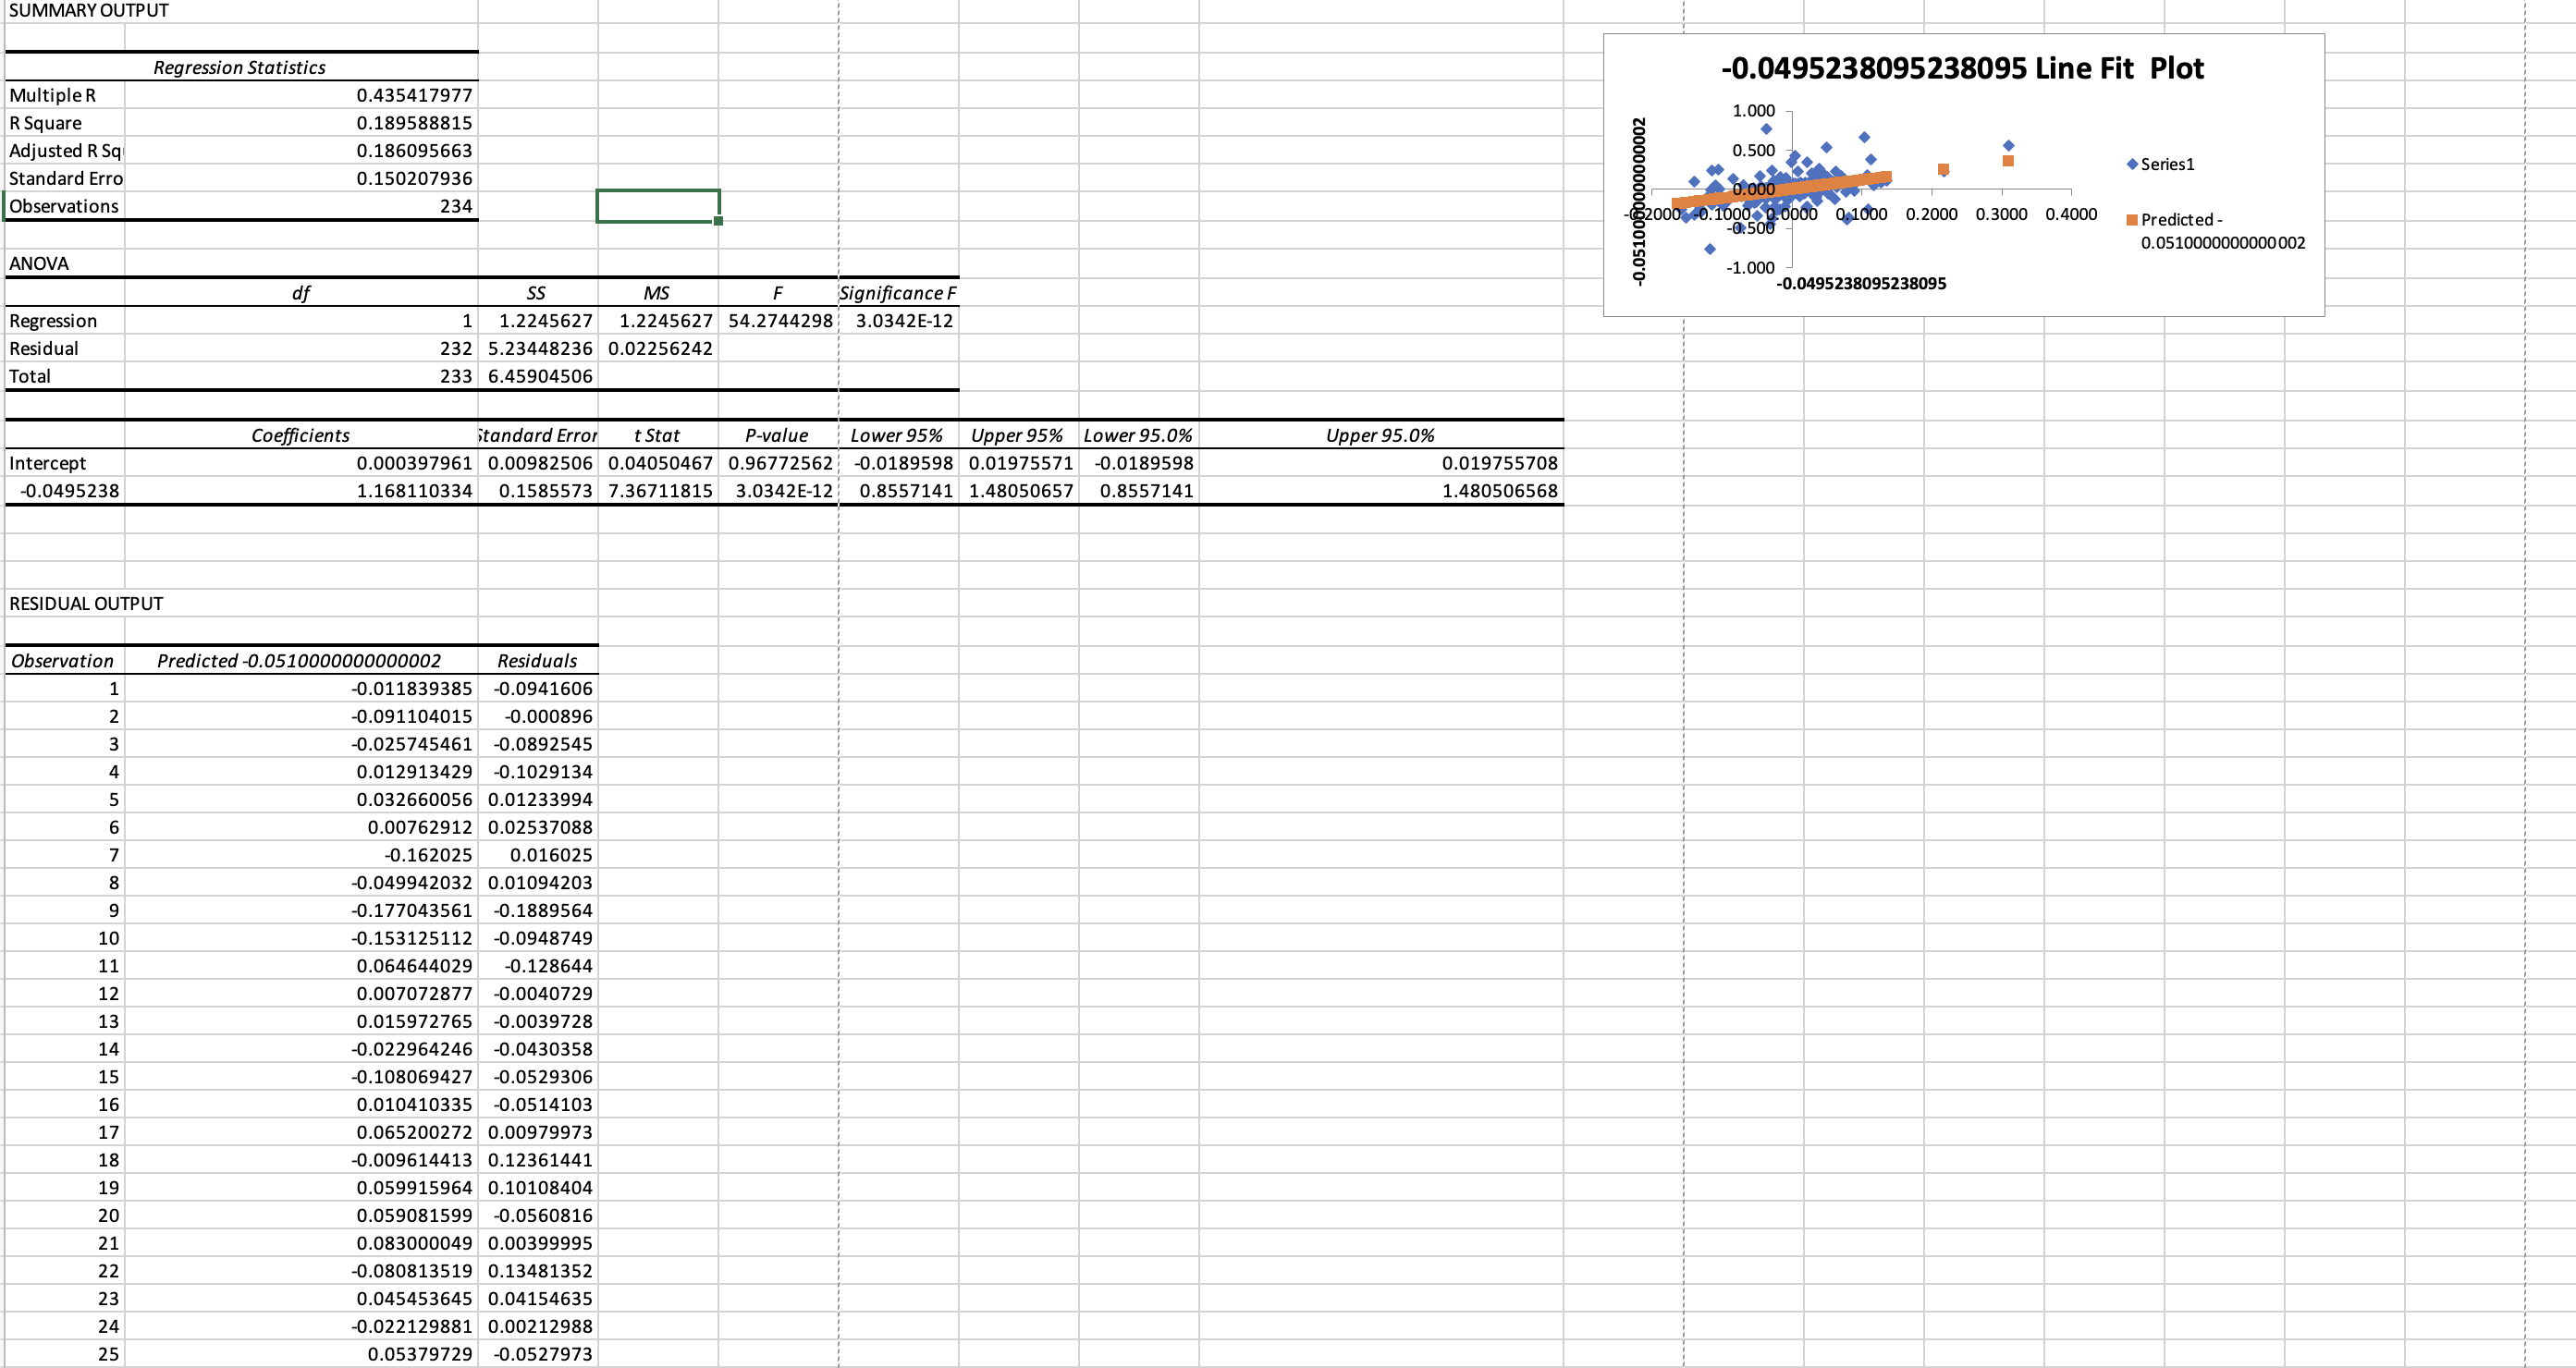
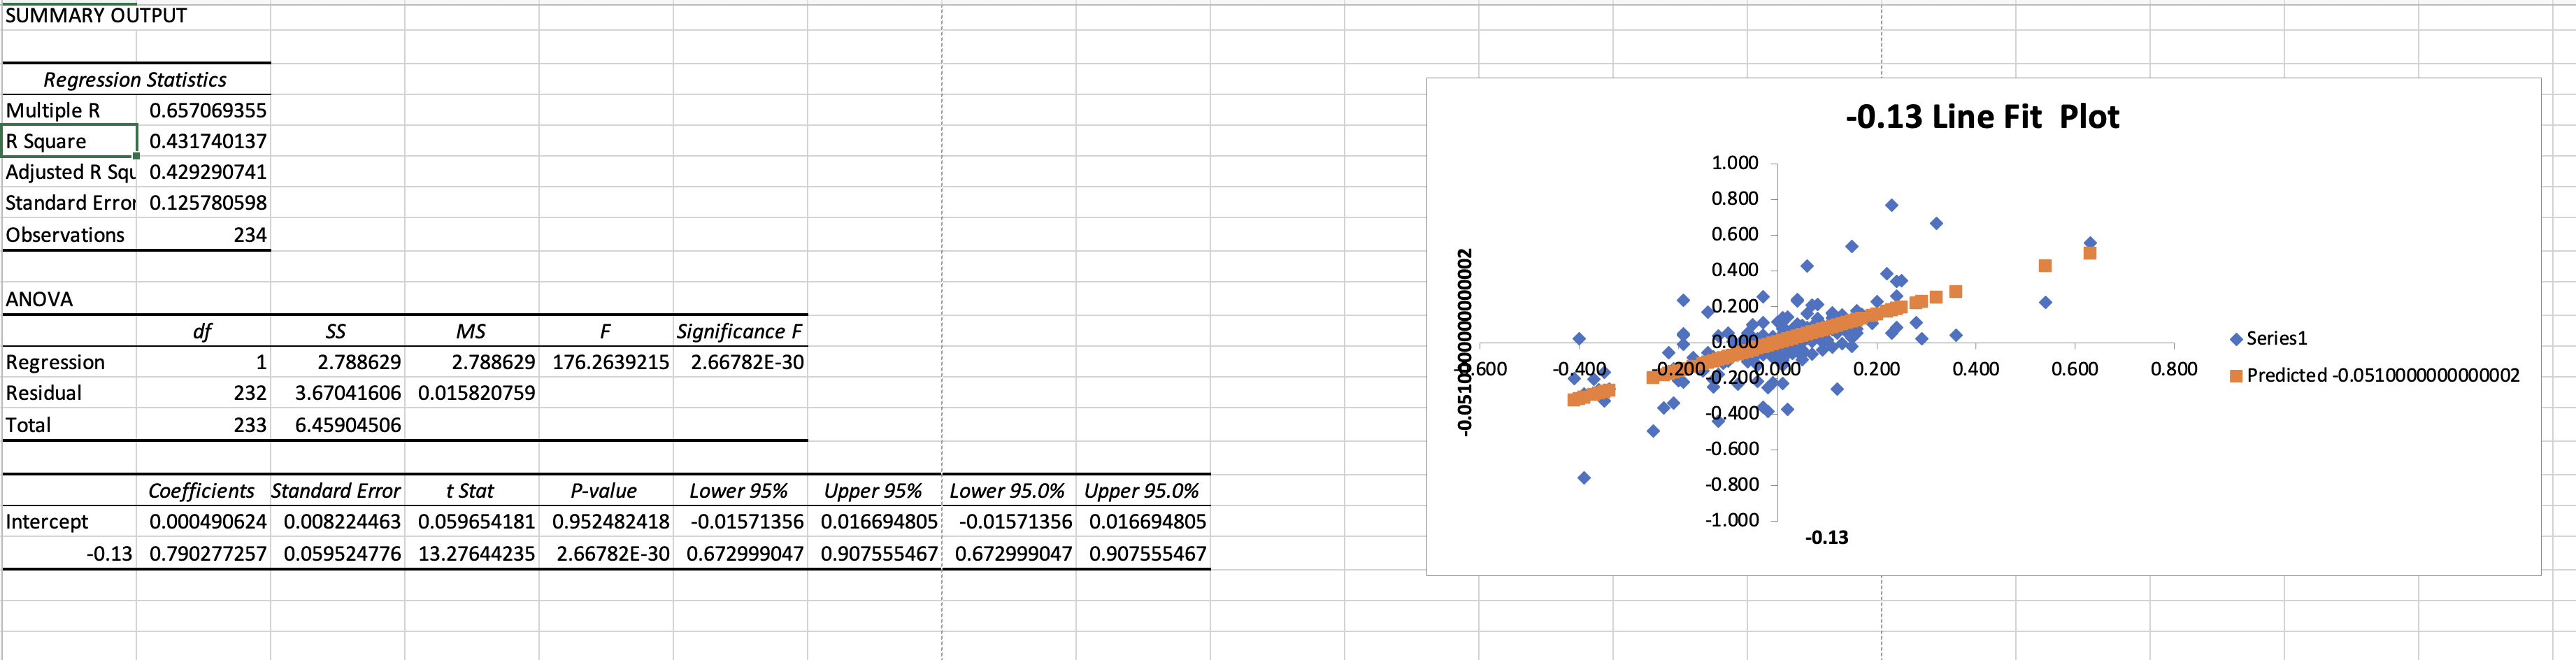
Question: Estimate the optimal hedge ratio using regression analysis using close price data from the beginning of the sample period until July 5, 2024. Use price

Estimate the optimal hedge ratio using regression analysis using close price data from the beginning of the sample period until July 5, 2024. Use price changes in your model. Tabulate the estimated results in the report, explain them in detail, and recommend the most suitable Futures contract for hedging.(6 marks).

Can you give me the full instructions as well as the formula for optimal hedge ratio using regression analysis in this case ?

Estimate the optimal hedge ratio using regressionEstimate the optimal hedge ratio using regression
SUMMARY OUTPUT Regression Statistics -0.0495238095238095 Line Fit Plot Multiple R 0.435417977 1.000 R Square 0.189588815 Adjusted R Sq .186095663 0.500 Series1 Standard Erro 0.150207936 0.000 Observations 234 -0.0510060000000002 2000 0.1000 0.0600 0 1000 0.2000 0.3000 0.4000 -0:500 Predicted - 0.0510000000000 002 ANOVA -1.000 SS MS F Significance F -0.0495238095238095 Regression 1 1.2245627 1.2245627 54.2744298 3.0342E-12 Residual 232 5.23448236 0.02256242 Tota 233 6.45904506 Coefficients Standard Error t Stat P-value Lower 95% Upper 95% Lower 95.0% Upper 95.0% Intercept 0.000397961 0.00982506 0.04050467 0.96772562 -0.0189598 0.01975571 -0.0189598 0.019755708 -0.0495238 1.168110334 0.1585573 7.36711815 3.0342E-12 0.8557141 1.48050657 0.8557141 1.480506568 RESIDUAL OUTPUT Observation Predicted -0.0510000000000002 Residuals 011839385 -0.0941606 0.091104015 -0.000896 0.025745461 -0.0892545 0.012913429 -0.1029134 0.032660056 0.01233994 0.00762912 0.02537088 0.162025 0.016025 -0.049942032 0.01094203 0.177043561 -0.1889564 0.153125112 -0.0948749 0.064644029 -0.128644 0.007072877 -0.0040729 0.015972765 -0.0039728 0.022964246 -0.0430358 0.108069427 -0.0529306 0.010410335 -0.0514103 0.065200272 0.00979973 18 -0.009614413 0.12361441 19 0.059915964 0.10108404 20 0.059081599 -0.0560816 21 0.083000049 0.00399995 22 0.080813519 0.13481352 23 0.045453645 0.04154635 24 0.022129881 0.00212988 25 0.05379729 -0.0527973SUMMARY OUTPUT Regression Statistics Multiple R 0.657069355 -0.13 Line Fit Plot R Square 0.431740137 Adjusted R Squ 0.429290741 1.000 Standard Error 0.125780598 0.800 Observations 234 0.600 0.400 ANOVA 0.200 df SS MS F Significance F -0.0510600000000002 0:000 Series1 Regression 1 2.788629 2.788629 176.2639215 2.66782E- 600 0,400 0:200 0.209.900 0.200 0.400 0.600 0.800 Predicted -0.0510000000000002 Residual 232 3.67041606 0.015820759 0.400 Total 233 6.45904506 0.600 Coefficients Standard Error t Stat P-value Lower 95% Upper 95% Lower 95.0% Upper 95.0% -0.800 Intercept 0.000490624 0.008224463 0.059654181 0.952482418 -0.01571356 0.016694805 -0.01571356 0.016694805 -1.000 -0.13 -0.13 0.790277257 0.059524776 13.27644235 2.66782E-30 0.672999047 0.907555467 0.672999047 0.907555467

Step by Step Solution

There are 3 Steps involved in it

1 Expert Approved Answer
Step: 1 Unlock blur-text-image
Question Has Been Solved by an Expert!

Get step-by-step solutions from verified subject matter experts

Step: 2 Unlock
Step: 3 Unlock

Students Have Also Explored These Related Finance Questions!