

Question: Estimate your American Airlines Inc. Optimal Capital Structure: Having evaluated the firm's business and financial risks, now examine how much debt can or should your
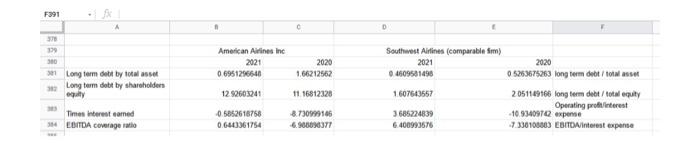
Estimate your American Airlines Inc. "Optimal Capital Structure": Having evaluated the firm's business and financial risks, now examine how much debt can or should your firm have. based on theory, adding more debt is likely to enhance firm value UP TO A POINT. That point being increasing debt without jeopardizing or threatening the survival or the credit worthiness of the firm. How do we evaluate that? Here are some things to help do that: 1. Credit rating of the firm or of its outstanding bonds 2. Level of Beta for your firm relative to other competitor firms 3. Check bond ratings vs level of debt utilized at comparable firms 4. Amount of debt relative to industry leverage ratio. F391 - fx A 376 379 300 381 Long term debt by total asset 382 Long term debt by shareholders equity 383 Times interest eamed 384 EBITDA coverage ratio n American Airlines Inc. 2021 0.6951296648 12 92603241 -0.5852616768 0.6443361754 2020 1.66212562 11.16812328 -8.730999146 6.906096377 D Southwest Airlines (comparable Smm) 2021 0.4609581498 1.607643557 3685224839 6.400993576 2020 05263675263 long term debt/total asset 2051149166 long term debt/total equity Operating profit interest -10.93409742 expense 7.336106863 EBITDA/interest expense Estimate your American Airlines Inc. "Optimal Capital Structure": Having evaluated the firm's business and financial risks, now examine how much debt can or should your firm have. based on theory, adding more debt is likely to enhance firm value UP TO A POINT. That point being increasing debt without jeopardizing or threatening the survival or the credit worthiness of the firm. How do we evaluate that? Here are some things to help do that: 1. Credit rating of the firm or of its outstanding bonds 2. Level of Beta for your firm relative to other competitor firms 3. Check bond ratings vs level of debt utilized at comparable firms 4. Amount of debt relative to industry leverage ratio. F391 - fx A 376 379 300 381 Long term debt by total asset 382 Long term debt by shareholders equity 383 Times interest eamed 384 EBITDA coverage ratio n American Airlines Inc. 2021 0.6951296648 12 92603241 -0.5852616768 0.6443361754 2020 1.66212562 11.16812328 -8.730999146 6.906096377 D Southwest Airlines (comparable Smm) 2021 0.4609581498 1.607643557 3685224839 6.400993576 2020 05263675263 long term debt/total asset 2051149166 long term debt/total equity Operating profit interest -10.93409742 expense 7.336106863 EBITDA/interest expense
Step by Step Solution
There are 3 Steps involved in it

Get step-by-step solutions from verified subject matter experts