

Question: (Estimating beta) From the graph below relating the holing period returns for Aram Inc. (in the Y-axis) to the S&P 500 Index (in the X-axis),
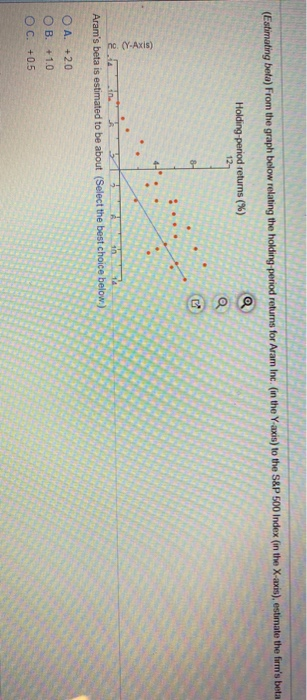
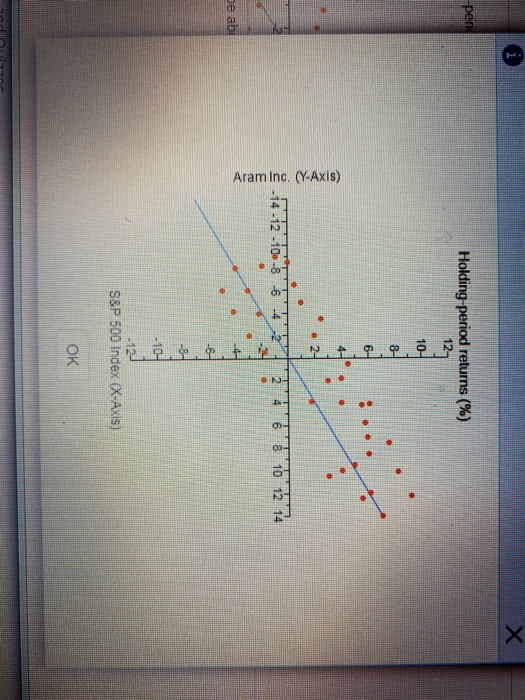
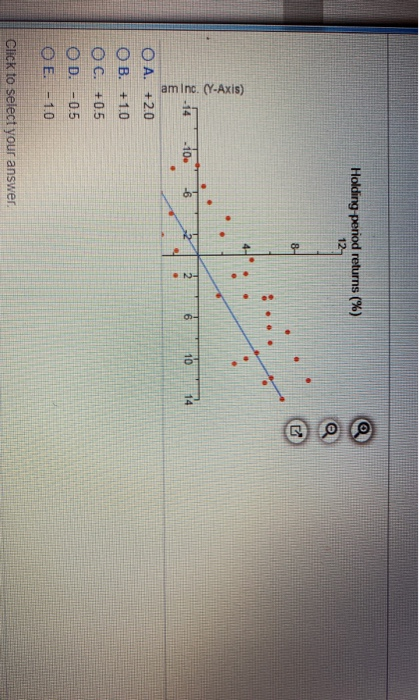
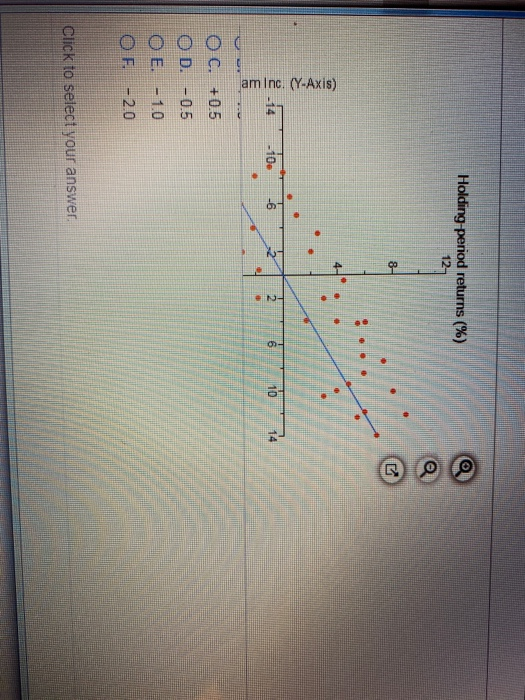
(Estimating beta) From the graph below relating the holing period returns for Aram Inc. (in the Y-axis) to the S&P 500 Index (in the X-axis), estimate the firm's beta Q Holding period returns (%) - 1 1 . no. (Y-Axis) Aram's beta is estimated to be about (Select the best choice below.) O A. +2.0 OB. +1.0 OC. +0.5 -pen Holding-period retums (%) 10- Aram Inc. (Y-Axis) 12-10-316 1346 8 10 12 74 De ale S&P 500 index (X-AXIS) OK inci Holding period returns (%) am Inc. (Y-Axis) O A. +2.0 OB. +1.0 OC. +0.5 OD. -0.5 O E. - 1.0 Click to select your answer. Holding period returns (%) am Inc. (Y-Axis) O C. +0.5 OD. -0.5 OE. - 10 OF. -20 Click to select your
Step by Step Solution
There are 3 Steps involved in it

Get step-by-step solutions from verified subject matter experts