

Question: ET Data, Significant Fig... 2 / 4 100% + recision and accuracy Calculate the range and the % variation for the three data series given
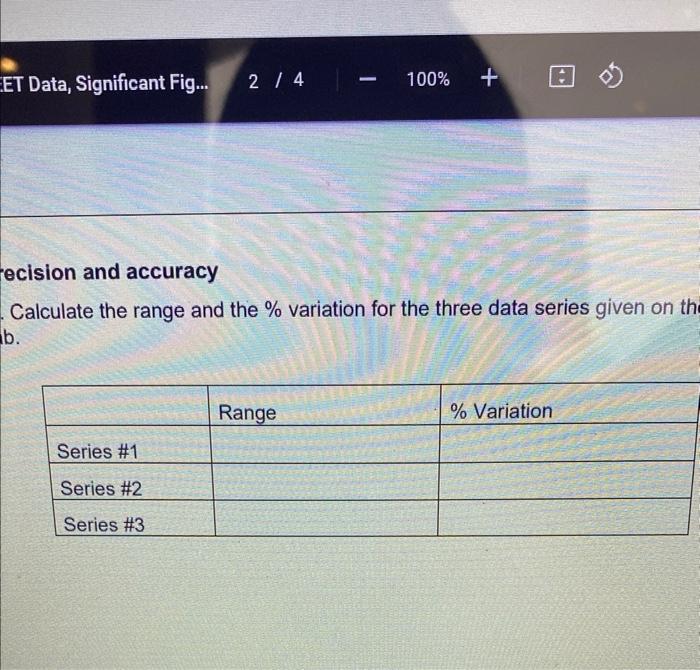
ET Data, Significant Fig... 2 / 4 100% + recision and accuracy Calculate the range and the % variation for the three data series given on the b. Range % Variation Series #1 Series #2 Series #3 ET Data, Significant Fig... 2 / 4 100% + recision and accuracy Calculate the range and the % variation for the three data series given on the b. Range % Variation Series #1 Series #2 Series #3
Step by Step Solution
There are 3 Steps involved in it
1 Expert Approved Answer
Step: 1 Unlock

Question Has Been Solved by an Expert!
Get step-by-step solutions from verified subject matter experts
Step: 2 Unlock
Step: 3 Unlock