

Question: etting Started it 1-Linear use a calculator. 2. The table shows pork production in China from 2000 to 2007. Use a calculator to answer
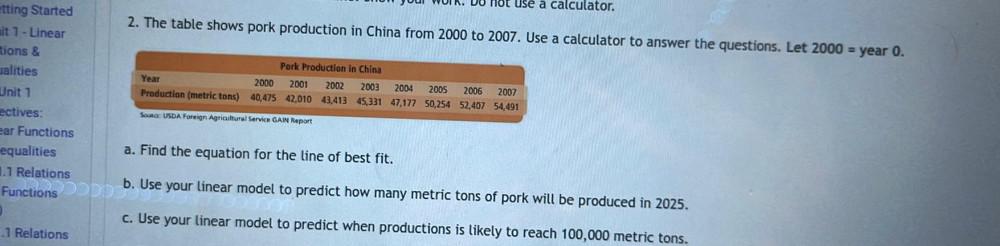
etting Started it 1-Linear use a calculator. 2. The table shows pork production in China from 2000 to 2007. Use a calculator to answer the questions. Let 2000 = year 0. tions & ualities Unit 1 ectives: ear Functions equalities .1 Relations Functions 1 Relations D Year Pork Production in China 2000 2001 2002 2003 2007 2004 2005 2006 Production (metric tons) 40,475 42,010 43,413 45,331 47,177 50,254 52,407 54,491 Soma USDA Foreign Agricultural Service GAIN Report a. Find the equation for the line of best fit. b. Use your linear model to predict how many metric tons of pork will be produced in 2025. c. Use your linear model to predict when productions is likely to reach 100,000 metric tons.
Step by Step Solution
There are 3 Steps involved in it

Get step-by-step solutions from verified subject matter experts