

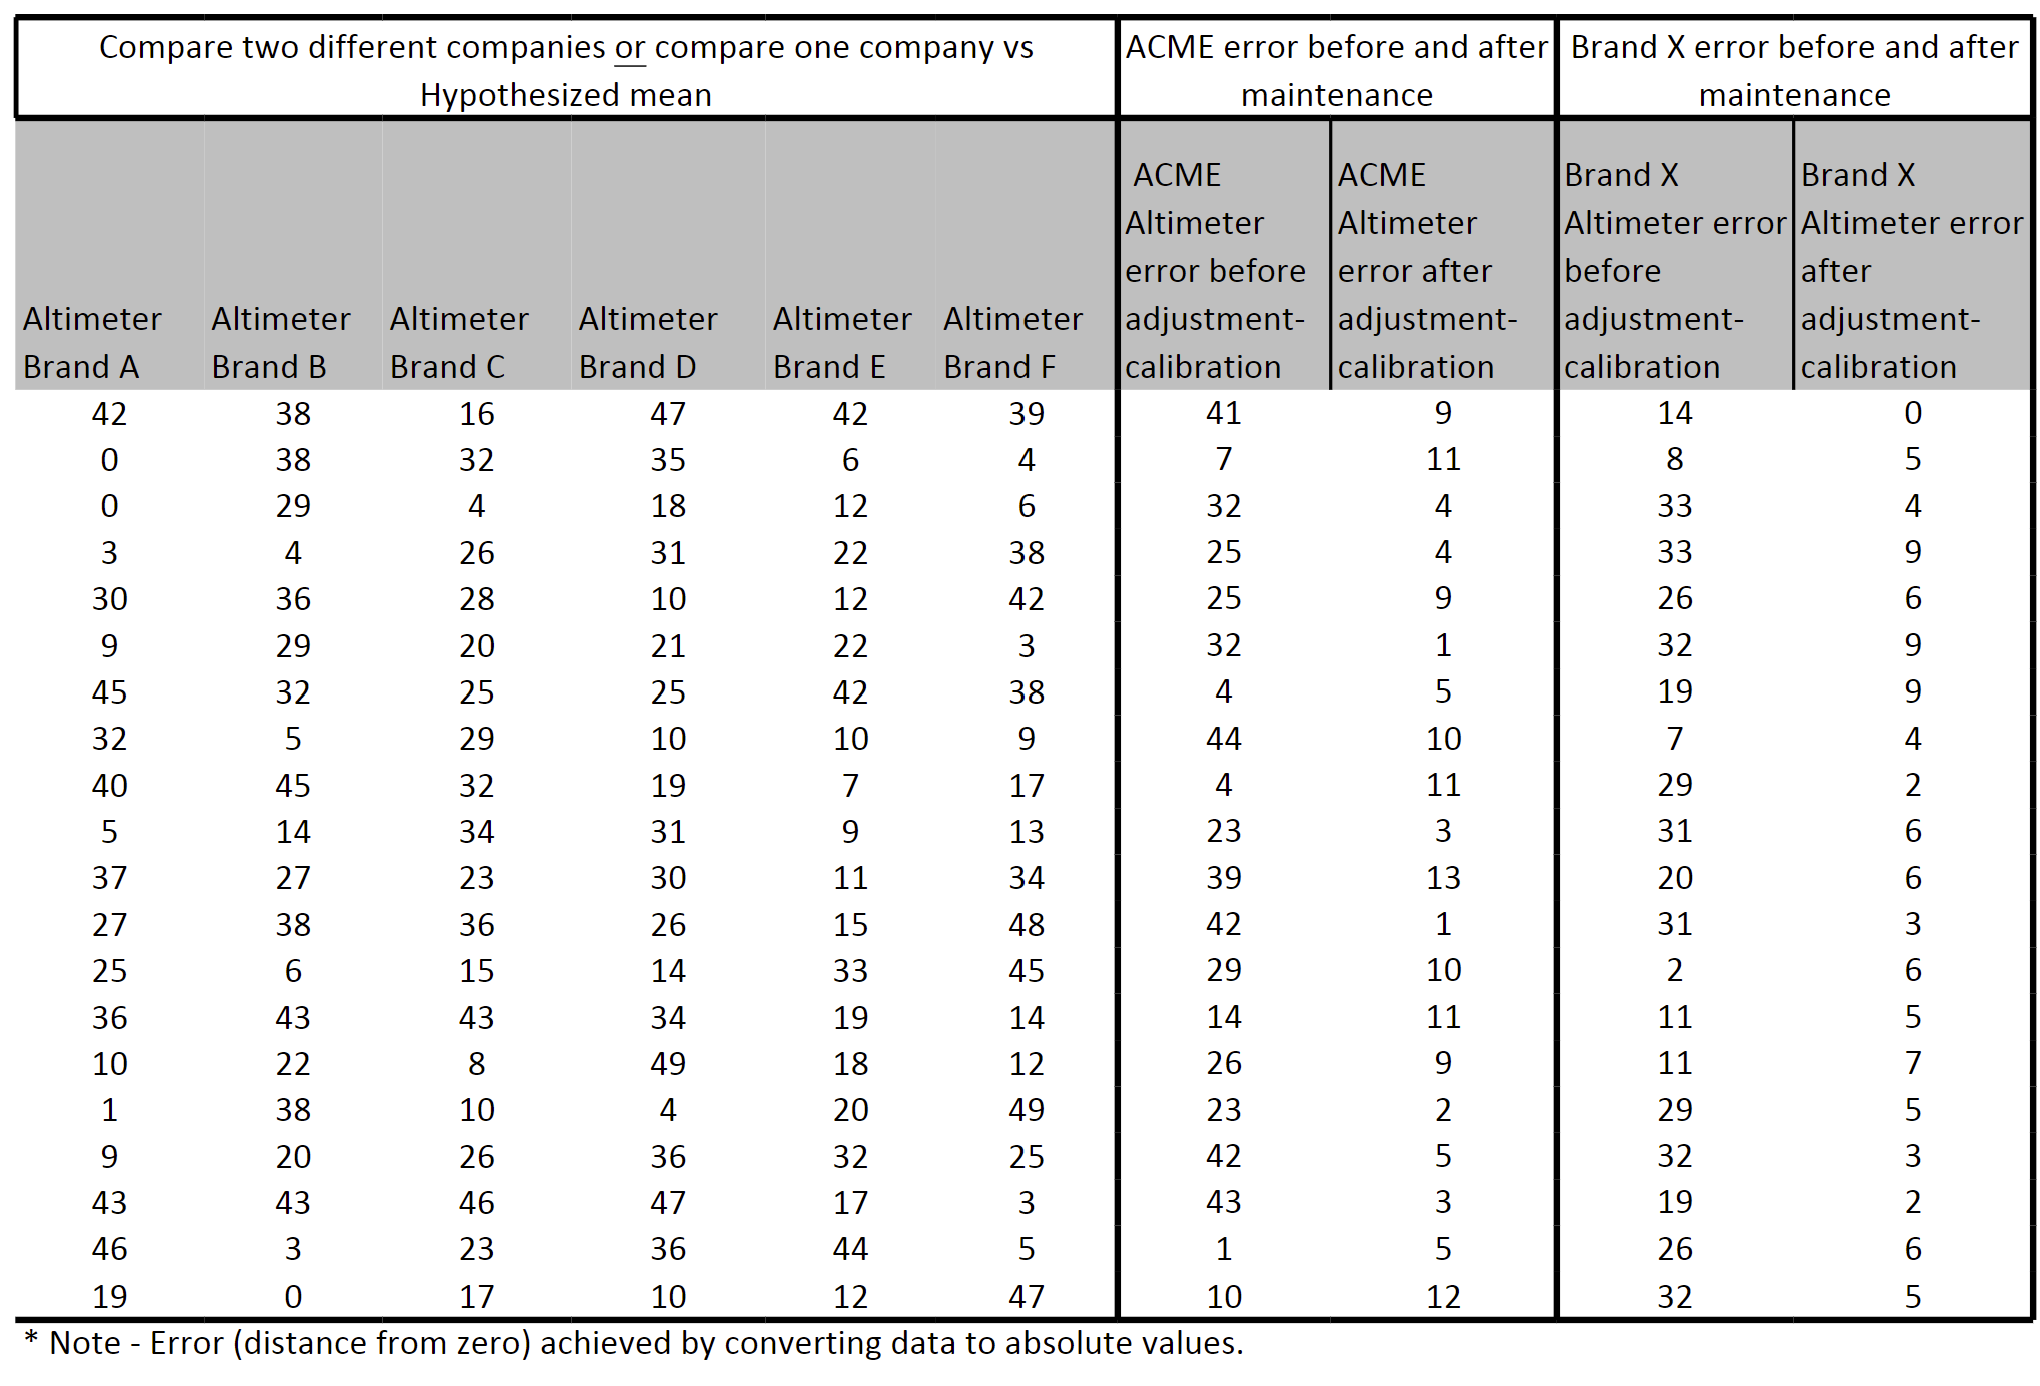
Question: Evaluate an aircraft altimeter data sample below from different companies to determine if there are any differences in error. You have the following three options
Evaluate an aircraft altimeter data sample below from different companies to determine if there are any differences in error. You have the following three options for running the appropriate t-test.
- Option 1 - compare one brand against a hypothesized mean to determine if the brand is statistically different than the assumed norm. In this case, you would have to cite where the hypothesized population mean came from.
- Option 2 - compare one brand against another to see if there are significant differences between them.
- Option 3 - compare either altimeter error of ACME or Brand X before adjustment and calibration and after adjustment and calibration to see if there are any differences in the means (performance).
Based on the type of dependent variable data (ratio) and the type of question in the scenario, you will use a t-test. There are three different types of t-tests you can use:
- One sample t-test (test for one population mean using Excel)
- Two sample t-test (hypothesis test for two population means using Excel)
- Paired t-test (compare before and after values for one type using Excel)
Then, construct a hypothesis and address the following:
- Describe what you are comparing.
- State your hypothesis in a sentence.
- Indicate the appropriate t-test that you will use to evaluate your hypothesis.
- State the alpha (?) level.
Compare two different companies g compare one company vs ACME error before and after Brand X error before and after Hypothesized mean maintenance maintenance U'IGWNWU'INU'IGWWOWOWNhLDKDO'KD-PU'IO * Note Error (distance from zero) achieved by converting data to absolute values
Step by Step Solution
There are 3 Steps involved in it

Get step-by-step solutions from verified subject matter experts