

Question: Evaluate each plan and find out which one is better in terms of total costs - Plan 1: for the manufacturer is to maintain a
Evaluate each plan and find out which one is better in terms of total costs
- Plan 1: for the manufacturer is to maintain a constant workforce throughout the 6-month period. we assume that the production per day is average requirements ( average production per day) and that we have a constant workforce, no overtime or idle time, no safety stock, and no subcontractors. The firm accumulates inventory during the slack period of demand, January through March, and depletes it during the higher-demand warm season, April through June. We assume beginning inventory = 0 and planned ending inventory = 0.
- Plan 2: is to maintain a constant workforce at a level necessary to meet the lowest demand month ( February ) and to meet all demand above this level by subcontracting.
by word and solve excel
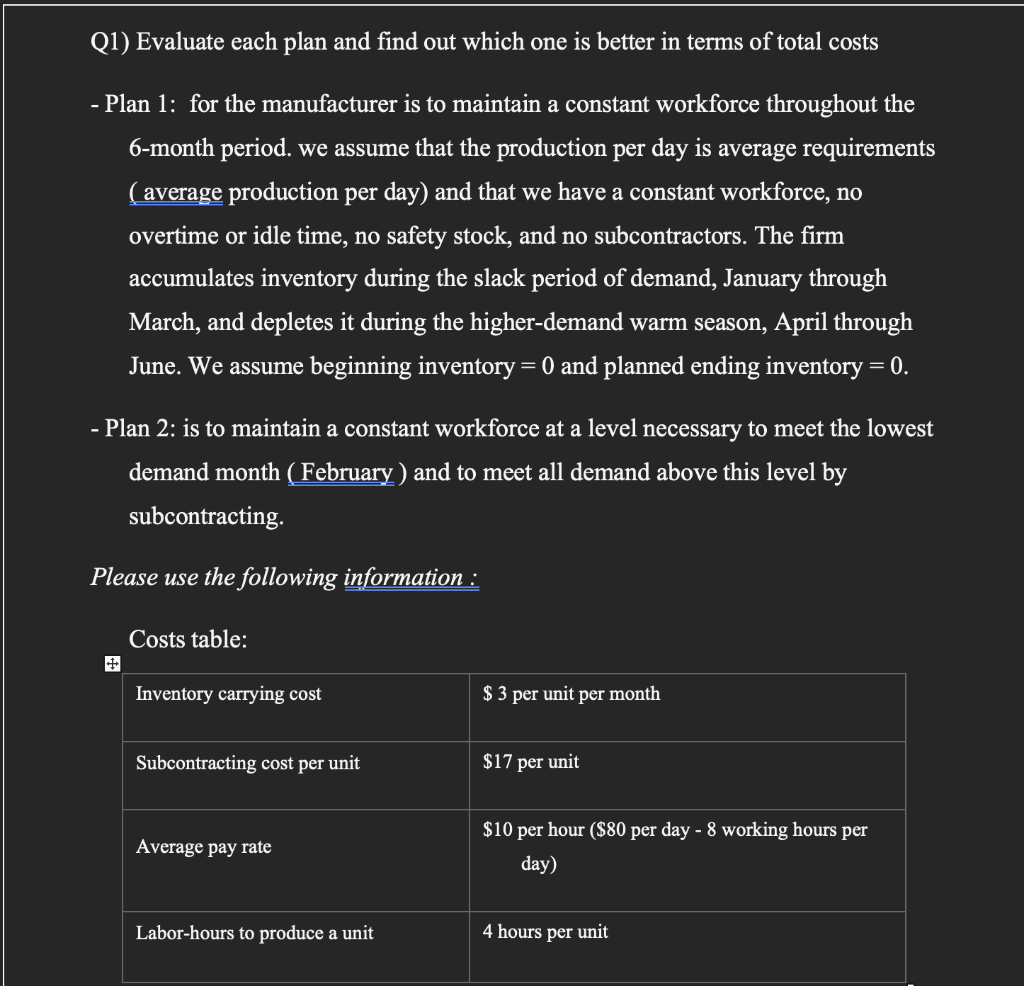
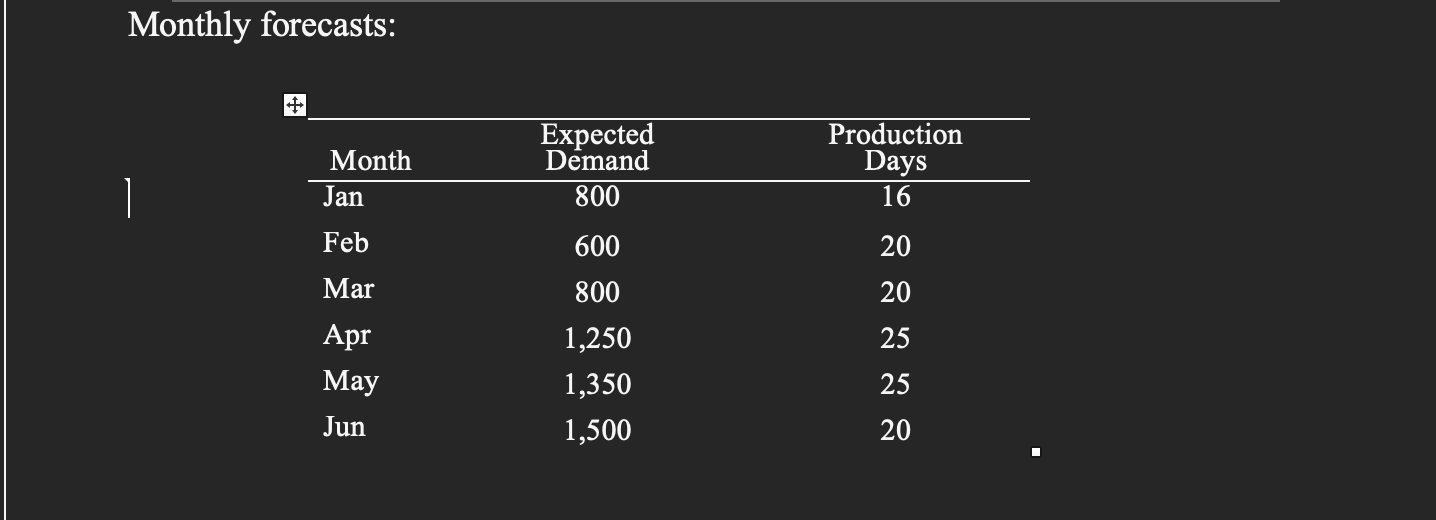
Q1) Evaluate each plan and find out which one is better in terms of total costs - Plan 1: for the manufacturer is to maintain a constant workforce throughout the 6-month period. we assume that the production per day is average requirements ( average production per day) and that we have a constant workforce, no overtime or idle time, no safety stock, and no subcontractors. The firm accumulates inventory during the slack period of demand, January through March, and depletes it during the higher-demand warm season, April through June. We assume beginning inventory = 0 and planned ending inventory = 0. - - Plan 2: is to maintain a constant workforce at a level necessary to meet the lowest demand month ( February ) and to meet all demand above this level by subcontracting Please use the following information : Costs table: Inventory carrying cost $ 3 per unit per month Subcontracting cost per unit $17 per unit Average pay rate $10 per hour ($80 per day - 8 working hours per day) Labor-hours to produce a unit 4 hours per unit Monthly forecasts: . T Month Jan Expected Demand 800 Production Days 16 Feb 600 800 Mar Apr May Jun 1,250 1,350 1,500 20 20 25 25 20Step by Step Solution
There are 3 Steps involved in it

Get step-by-step solutions from verified subject matter experts