

Question: Evaluate log, 22 to two decimal places: O 141 0.15 0.39 O 0.71 What is the exact value of the exponential equation, 4(10) = 200?

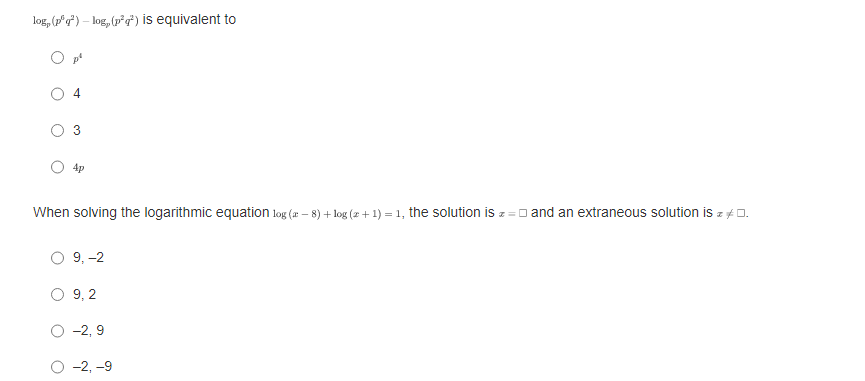

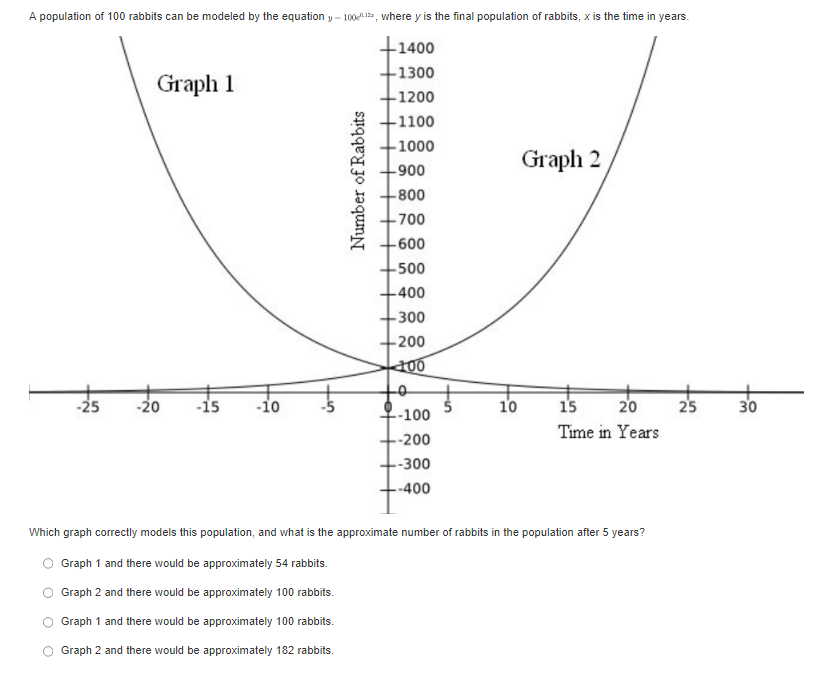
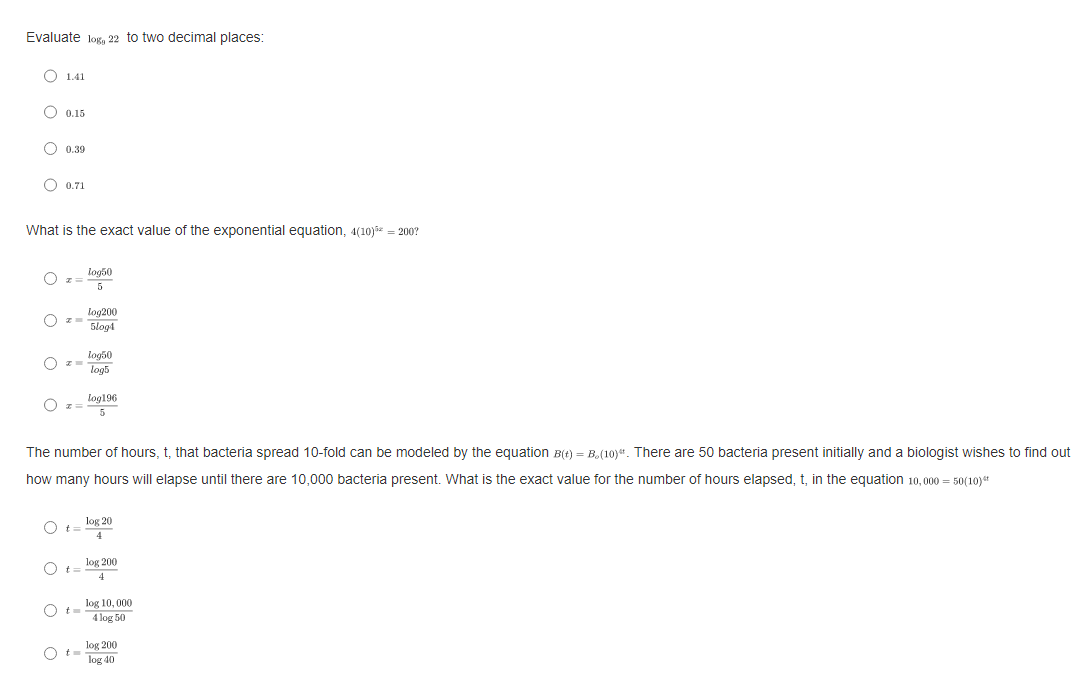

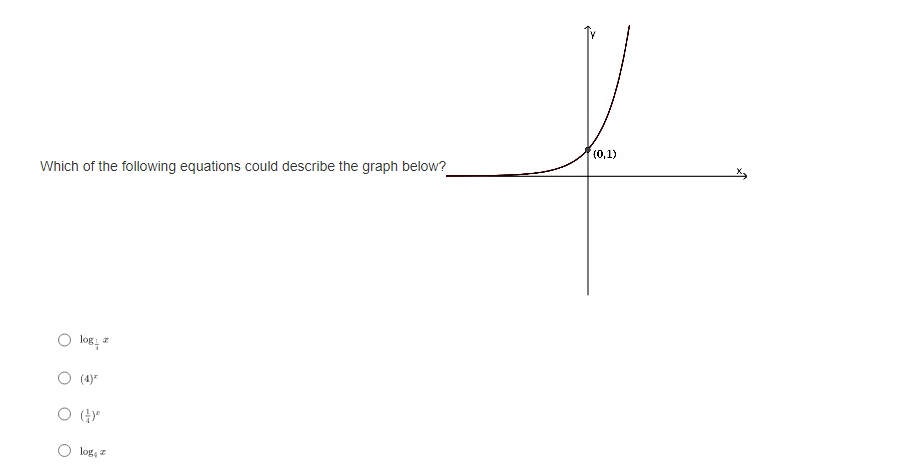

Evaluate log, 22 to two decimal places: O 141 0.15 0.39 O 0.71 What is the exact value of the exponential equation, 4(10) = 200? 10950 Log200 5log1 10950 O log5 Log196 5 The number of hours, t, that bacteria spread 10-fold can be modeled by the equation B(t) = B.(10)". There are 50 bacteria present initially and a biologist wishes to find out how many hours will elapse until there are 10,000 bacteria present. What is the exact value for the number of hours elapsed, t, in the equation 10,000 = 50(10)" Of= log 20 Of= log 200 log 10, 000 4 log 50 O log 200 log 40log, (p"q') - log (p q]) is equivalent to O 0 4 O 3 O Ap When solving the logarithmic equation log (x - 8) + log (2 + 1) =1, the solution is z = 0 and an extraneous solution is z / 0. 0 9, -2 0 9,2 O -2,9 O -2, -9(0,1) Which of the following equations could describe the graph below? O (4) O log, IA population of 100 rabbits can be modeled by the equation y - 100 , where y is the final population of rabbits, x is the time in years. 1400 .1300 Graph 1 -1200 -1100 -1000 900 Graph 2 Number of Rabbits -800 700 1 600 500 400 -300 -200 400 -25 -20 -15 -10 10 15 20 2'5 30 -100 -200 Time in Years -300 --400 Which graph correctly models this population, and what is the approximate number of rabbits in the population after 5 years? O Graph 1 and there would be approximately 54 rabbits. O Graph 2 and there would be approximately 100 rabbits. O Graph 1 and there would be approximately 100 rabbits. O Graph 2 and there would be approximately 182 rabbits
Step by Step Solution
There are 3 Steps involved in it

Get step-by-step solutions from verified subject matter experts