

Question: Evaluate the company's current financial plan, including charts and/or graphs showing financial data from the struggling company and make recommendations for improvement. Determine strategies


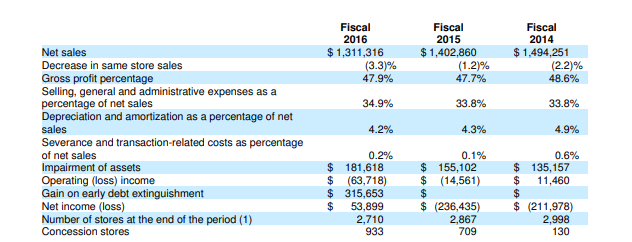
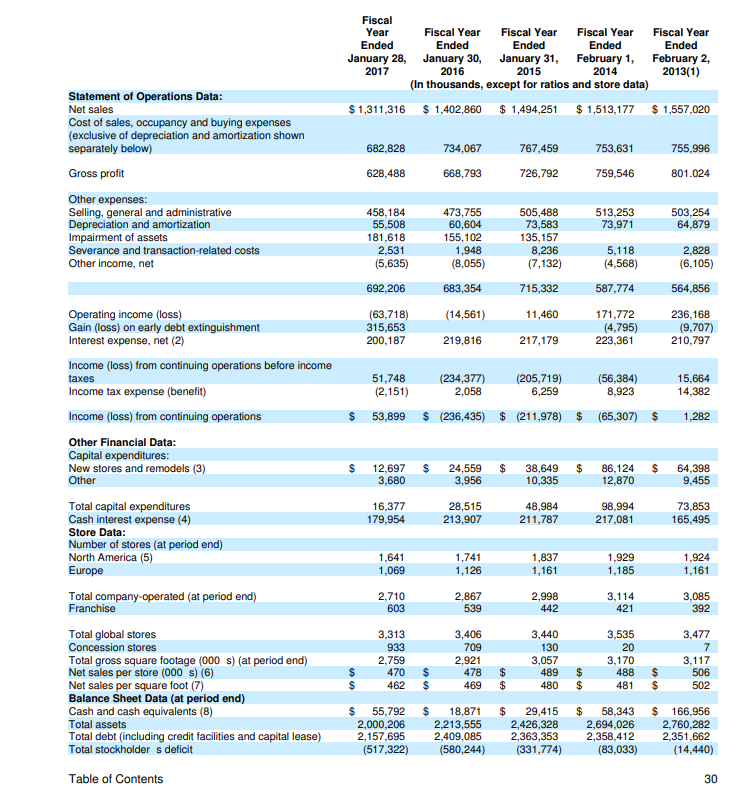
Evaluate the company's current financial plan, including charts and/or graphs showing financial data from the struggling company and make recommendations for improvement. Determine strategies for achieving a sustainable competitive advantage in the marketplace and increasing financial performance. Create a plan to implement the strategies you selected. 1. Evaluation of the company's current financial plan and recommendations for improvement (weight 30%) Comprehensively evaluated the company's current financial plan from a creative and innovative perspective, included fully relevant charts and/or graphs of company's financial data, and made a comprehensive, creative, and innovative connection between recommendations for improvement and company's current financial state 2. Strategies for achieving sustainable Thoroughly evaluated strategies for competitive advantage (weight 30%) achieving sustainable competitive advantage in the marketplace and increasing financial performance from a creative and innovative perspective 3. Plan to implement the selected strategies (weight 40%) Created a thorough, creative, and innovative plan to implement strategies Conduct a strategic analysis of the company's current financial operations. Determine strategies for achieving a sustainable competitive advantage in the marketplace and increasing financial performance. Fiscal Fiscal 2016 2015 Fiscal 2014 Net sales $1,311,316 $1,402,860 $1,494,251 Decrease in same store sales (3.3)% (1.2)% (2.2)% Gross profit percentage 47.9% 47.7% 48.6% Selling, general and administrative expenses as a percentage of net sales 34.9% 33.8% 33.8% Depreciation and amortization as a percentage of net sales 4.2% 4.3% 4.9% Severance and transaction-related costs as percentage of net sales 0.2% 0.1% 0.6% Impairment of assets $ 181,618 $ 155,102 $ 135,157 Operating (loss) income $ (63,718) $ (14,561) $ 11,460 Gain on early debt extinguishment $ 315,653 $ $ Net income (loss) $ 53,899 $ (236,435) Number of stores at the end of the period (1) Concession stores 2,710 933 2,867 709 $ (211,978) 2,998 130 Statement of Operations Data: Net sales Cost of sales, occupancy and buying expenses (exclusive of depreciation and amortization shown Fiscal Year Fiscal Year Ended ***** Fiscal Year Ended Fiscal Year Ended January 28, January 30, 2017 2016 Fiscal Year Ended January 31, 2015 Ended February 1, February 2, 2013(1) 2014 (In thousands, except for ratios and store data) $1,311,316 $ 1,402,860 $1,494,251 $1,513,177 $1,557,020 separately below) Gross profit 682,828 734,067 767,459 753,631 755,996 628,488 668,793 726,792 759,546 801.024 Other expenses: Selling, general and administrative 458,184 473,755 505,488 513,253 Depreciation and amortization 55,508 60,604 73,583 73,971 503,254 64,879 Impairment of assets 181,618 155,102 135,157 Severance and transaction-related costs 2,531 1,948 8,236 5,118 2,828 Other income, net (5,635) (8,055) (7,132) (4,568) (6,105) 692,206 683,354 715,332 587,774 564,856 Operating income (loss) (63,718) (14,561) 11,460 171,772 236,168 Gain (loss) on early debt extinguishment 315,653 (4,795) (9,707) Interest expense, net (2) 200,187 219,816 217,179 223,361 210,797 Income (loss) from continuing operations before income taxes 51,748 Income tax expense (benefit) (2,151) (234,377) 2,058 (205,719) 6,259 (56,384) 15,664 8,923 14,382 Income (loss) from continuing operations 53,899 $ (236,435) $ (211,978) $ (65,307) $ 1,282 Other Financial Data: Capital expenditures: New stores and remodels (3) Other Total capital expenditures Cash interest expense (4) Store Data: Number of stores (at period end) North America (5) 12,697 24,559 38,649 86,124 64,398 3,680 3,956 10,335 12,870 9,455 16,377 28,515 48,984 98,994 73.853 179,954 213,907 211,787 217,081 165,495 1,641 1,741 1,837 1,929 1,924 Europe 1,069 1,126 1,161 1,185 1,161 Total company-operated (at period end) Franchise 2,710 2,867 2,998 3,114 3,085 603 539 442 421 392 Total global stores 3,313 Concession stores 933 3,406 709 3,440 130 3,535 20 3,477 7 Total gross square footage (000 s) (at period end) 2,759 2,921 3,057 3,170 3,117 Net sales per store (000 s) (6) 470 $ 478 $ Net sales per square foot (7) $ 462 $ 469 $ 69 69 489 $ 480 6969 488 506 $ 481 $ 502 Balance Sheet Data (at period end) Cash and cash equivalents (8) $ 55,792 $ Total assets 2,000,206 18,871 2,213,555 $ 29,415 $ 58,343 $ 166,956 Total debt (including credit facilities and capital lease) 2,157,695 2,409,085 Total stockholder s deficit (517,322) (580,244) 2,426,328 2,363,353 (331,774) 2,694,026 2,358,412 (83,033) Table of Contents 2,760,282 2,351,662 (14,440) 30 30
Step by Step Solution
There are 3 Steps involved in it

Get step-by-step solutions from verified subject matter experts