

Question: Evaluate the project using Adjusted Present Value. Assume the debt will be paid back in equal installments over the life of the project. The cost
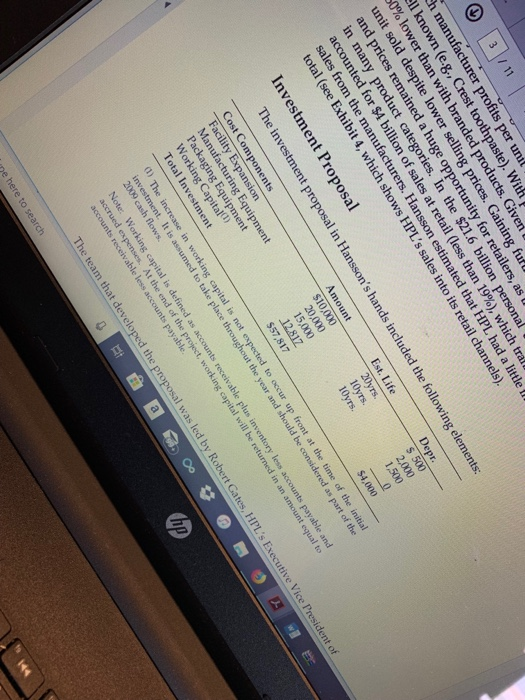
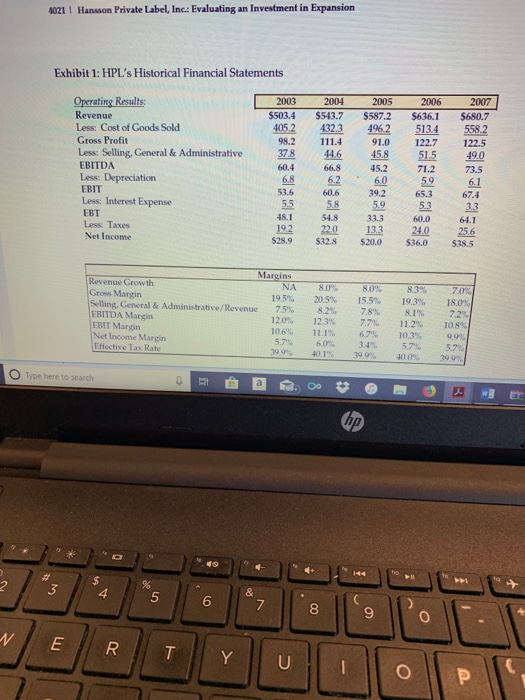
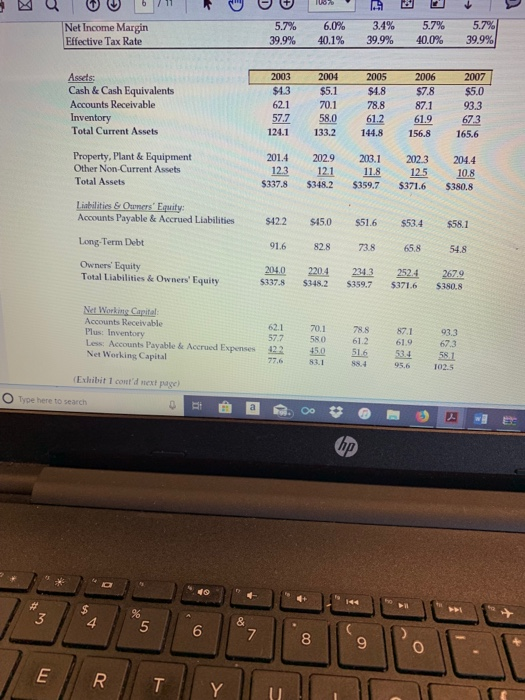
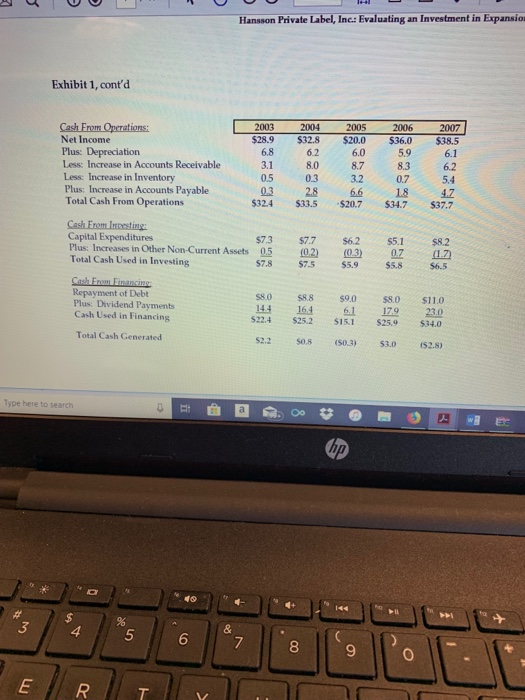
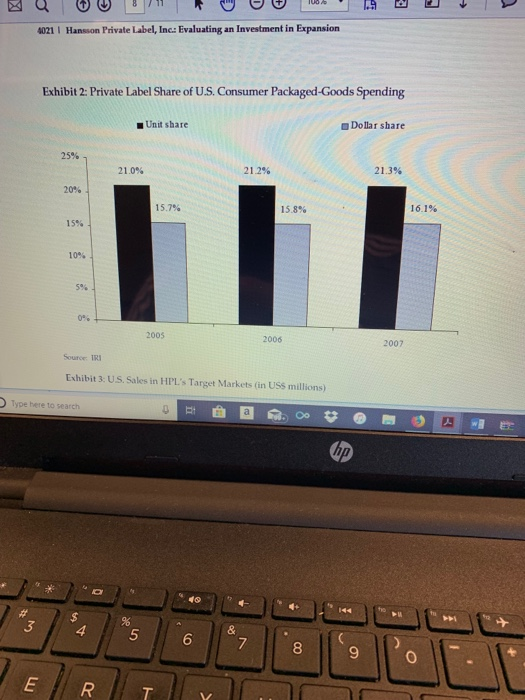
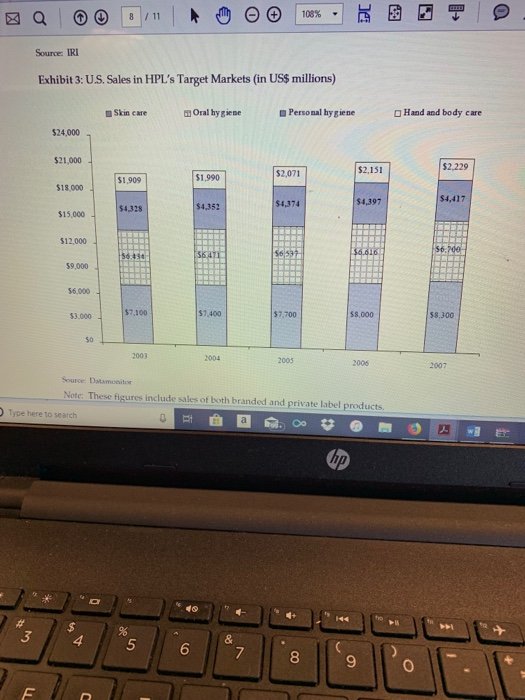
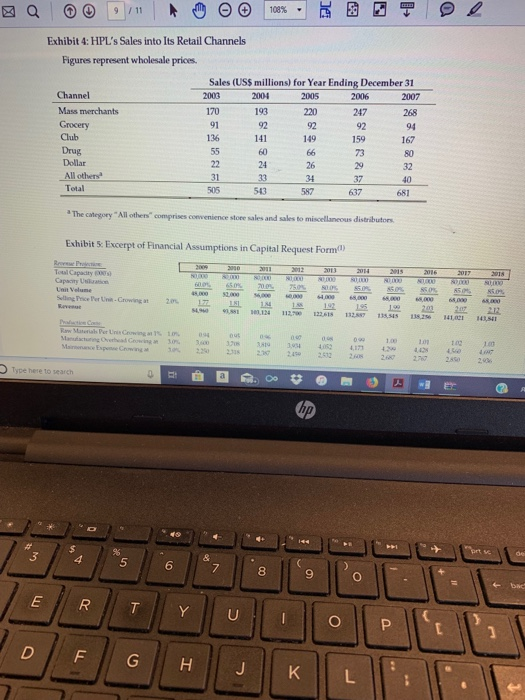
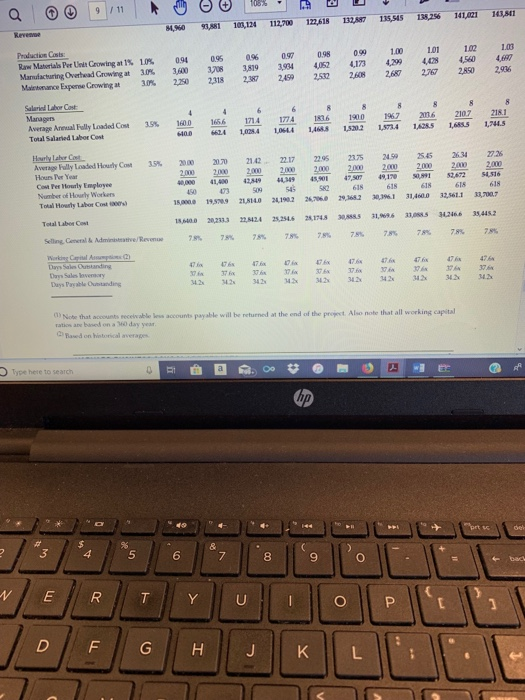
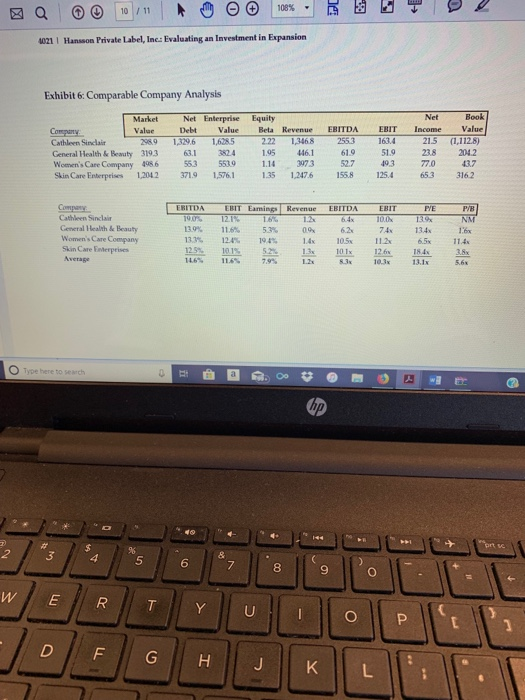
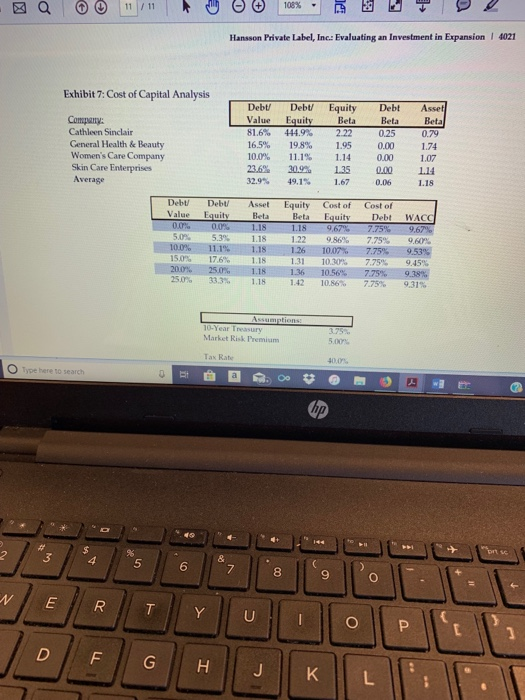
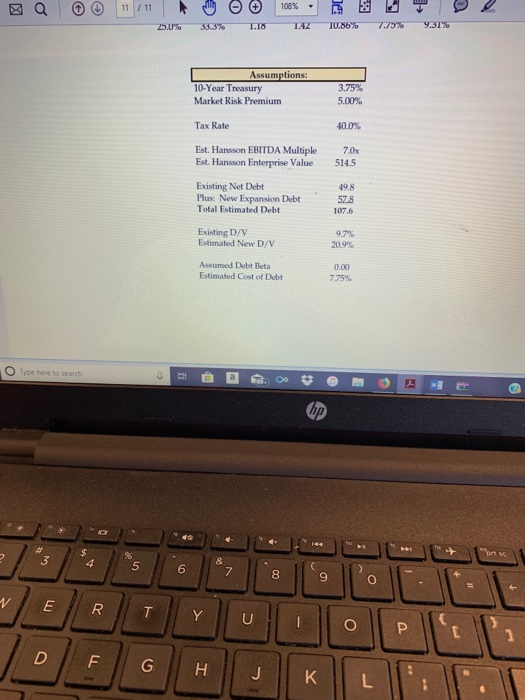
3 11 h manufacturer profits per unit ll known (e.g., Crest toothpaste). Wit 0% lower than with branded products. Given unit sold despite lower selling prices. Gaining fur and prices remained a huge opportunity for retailers, as in many product categories. In the $21.6 billion personal accounted for $4 billion of sales at retail (less than 19% ) , which trafa sales from the manufacturers. Hansson estimated that HPL had a little total (see Exhibit 4, which shows HPL's sales into its retail channels). Investment Proposal The investment proposal in Hansson's hands included the following elements: Cost Components Depr. S 500 2000 1,500 Amount Est. Life Facility Expansion Manufacturing Equipment Packaging Equipment Working Capital Total Investment $10,000 20.000 15,000 12812 20yrs. 10yrs 10yrs $57,817 $4,000 The increase in wo g capital is not espected to occur up front at the time of the initial investment. It is assumed to take place throughout the year and should be considered as part of the 2009 cash flows Note: Working capital is defined as accounts receivable plus inventory less accounts payable and accrued expenses. At the end of the project, working capital will be returned in an amount equal to accounts receivable less accounts Fayable. The team that developed the proposal was led by Robert Gates, HPL's Executive Vice President of wl a Oo e here to search hp 4021 1 Hansson Private Label, Inc: Evaluating an Investment in Expansion Exhibit 1: HPL's Historical Financial Statements Operating Results 2003 2004 2005 2006 2007 Revenue $503.4 $543.7 $587.2 $636.1 $680.7 558.2 Less: Cost of Goods Sold 405.2 432.3 496.2 513.4 Gross Profit 98.2 111.4 91.0 45.8 122.7 122.5 Less: Selling, General & Administrative EBITDA Less: Depreciation EBIT Less: Interest Expense 37.8 44.6 51.5 49.0 60.4 6,8 66,8 45.2 71.2 73.5 6.2 6.0 5.9 6.1 53,6 60,6 39.2 65.3 67.4 5.5 5.8 5.9 5.3 3.3 EBT Less: Taxes Net Income 48.1 54.8 33.3 60.0 64.1 19.2 22.0 13.3 24.0 25.6 $28.9 $32.8 $20,0 $36,0 $38.5 Margins NA Revenue Grow th Gross Margin Selling, General & Administrative/Revenue FBITDA Margin EBIT Margin Net Income Margin Effective Tax Rate 8.0% 8.0% 8.3% 70% 19.5% 20.5% 19.3 % 15.5% 18.0% 75% 12.0% 8.2% 7.8% 8.1% 7.2% 77 % 12.3% 11.2% 10.3 % 5.7% 40.0% 10.8% 10.6% 11.1% 67 % 34% 5.7% 6.0% 57% 39.9% 40.1% 39 9% 39 0% Type here to search hp 144 # 3 % 2 4 6 U 1P l inl T LC 5.7% 5.7% 3.4% 6.0% 5.7% Net Income Margin Effective Tax Rate 39,9% 39.9% 40.0% 40.1 % 39.9% 2007 2005 2006 2004 2003 Assets Cash & Cash Equivalents $7.8 $5.1 $5.0 $4.8 $4.3 93.3 78.8 87.1 62.1 57.7 70.1 Accounts Receivable 61.2 67.3 58.0 61.9 Inventory Total Current Assets 133.2 165.6 124.1 144.8 156,8 201.4 202.9 203.1 202.3 204.4 Property, Plant & Equipment Other Non-Current Assets Total Assets 12.3 12.1 11.8 12.5 10.8 $337.8 $348.2 $359.7 $371.6 $380.8 Liabilities & Owners' Equity: Accounts Payable & Accrued Liabilities. $42.2 $45.0 $51.6 $53.4 $58.1 Long-Term Debt 91.6 82.8 73.8 65.8 54.8 Owners' Equity Total Liabilities & Owners' Equity 204.0 220.4 252.4 234.3 267.9 $337.8 $371.6 $348.2 $359.7 $380.8 Net Working Capital Accounts Receivable Plus: Inventory Less: Accounts Payable & Accrued Expenses Net Working Capital 62.1 70.1 78.8 87.1 93.3 57.7 58.0 61.2 61.9 67.3 422 45.0 51.6 53.4 58.1 77.6 83.1 88.4 95.6 102.5 (Exltibit 1 cont'd mext page) Type here to search hp 144 $3 % 4 5 6 7 E R Y T O Hansson Private Label, Inc.: Evaluating an Investment in Expansion Exhibit 1, cont'd 2007 2004 2005 2006 2003 Cash From Operations: $36.0 5.9 $20.0 6.0 8.7 3.2 $38.5 6.1 $32.8 6.2 $28.9 6.8 Net Income Plus: Depreciation Less: Increase in Accounts Receivable Less: Increase in Inventory Plus: Increase in Accounts Payable Total Cash From Operations 8.3 6.2 5.4 8.0 3.1 07 0.3 0.5 18 $34.7 6.6 2.8 4.7 $37.7 0.3 $32.4 $33.5 $20.7 Cash Erom Inesting Capital Expenditures Plus: Increases in Other Non-Current Assets Total Cash Used in Investing $7.7 (0.2) $7.5 $6.2 (0.3) $5.1 0.7 $8.2 $7.3 (1.7) 0.5 $5,9 $5.8 $6.5 $7.8 Cash Erom Financing Repayment of Debt Plus Dividend Payments Cash Used in Financing $8.0 $8.8 16.4 $9.0 S8.0 $11.0 6.1 14.4 17.9 23.0 $22.4 $25.2 $15.1 $25,9 $34.0 Total Cash Generated $2.2 S0.8 (S0.3) $3,0 (S2,81 Type here to search hp 144 # % 4 5 6 7 8 E R T T00 A 4021 I Hansson Private Label, Inc: Evaluating an Investment in Expansion Exhibit 2: Private Label Share of U.S. Consumer Packaged-Goods Spending Dollar share Unit share 25% 21.3% 21.2% 21.0% 20% 16.1% 15.8% 15.7% 15% 10% 5% 0% 2005 2006 2007 Source IRI Exhibit 3: US. Sales in HPL's Target Markets (in USS millions) Type here to search a hp 4+ 144 & 4 5 6 7 E R LO 108% 8 /11 Source: IRI Exhibit 3: U.S. Sales in HPL's Target Markets (in US$ millions) Personal hygiene Skin care Oral hygiene Hand and body care $24.000 $21,000 $2,229 $2,151 $2,071 $1.990 $1,909 $18.000 $4,417 $4,397 $4,374 $4.352 $4.328 $15,000 $12,000 S6471 $9.000 $6,000 $7,100 $7.400 $7.700 $8.300 $8.000 $3.000 50 2003 2004 2005 2006 2007 Source: Datamonitor Note: These figures include sales of both branded and private label products. ) Type here to search hp 144 3 4 6 7 8 LO Q 108 % /11 Exhibit 4: HPL's Sales into Its Retail Channels Figures represent wholesale prices. Sales (US$ millions) for Year Ending December 31 Channel 2003 2004 2005 2006 2007 Mass merchants 170 193 220 247 268 Grocery 91 92 92 92 Club 136 141 149 159 167 Drug 55 60 66 73 80 Dollar 22 24 26 29 32 All others 31 33 34 37 40 Total 505 543 587 637 681 The category "All others" comprises convenience store sales and sales to miscellaneous distributors. Exhibit 5: Excerpt of Financial Assumptions in Capital Request Form Re Proe Toal Capadty 0s 2009 2000 2011 2012 2013 2014 2015 2016 2017 2018 s000 650% 000 80000 Capacity Uslation Unit Velume- Sellne Price Per Un-Crowing an 80000 82000 600 200% 5600 750% 80.0% 64.000 850% 68.000 850% 850% 85 850% s2000 4e000 68 000 68.000 68000 20m 68.00 17 181 91,881 184 188 192 Ravesne 195 132 882 196 203 207 212 143,84 101.124 11290 122.618 135545 138 756 141.021 Prowtion Co Raw Materials Pee Un Ce ng at 1% Manudactureg Orehead Ceoing Marnance Espense Cewing 10 out 0 30% 1.00 10 4428 3600 3208 2338 102 460 10 3810 3804 4052 4.171 42 2200 2307 24 2512 2608 2687 2767 2850 2906 Type here to search 144 prt s 5 6 7 bact T U D F G J K L e 8 108% 9 11 143,41 141,021 138.256 15.545 132A87 122618 112,700 10,124 93,881 84960 Revenoe 103 102 1,01 1.00 Praduction Costs Raw Materials Per Unit Crowing at 1 % 10 %. Manufacturing Overhead Crowing at Maintonance Experse Crowing at 099 098 097 096 4.697 095 4,560 0.94 4,428 4,299 4.173 4052 3,904 2,459 3819 3208 2,318 2936 3600 2,850 3.0% 2767 2687 2608 2532 2387 2,250 30% Saleriel Labor Cost Managers Average Aneual Felly Loaded Cost Total Salaried Labor Cost 6 4 218.1 2107 2016 1967 1900 183.6 177A 1714 165.6 1600 35% 1.744.5 1,685.5 1628.5 1573.4 1520.2 1,0644 1,4688 1.028.4 6624 640.0 27,26 2634 Harly Labor Cot Average Fully Lcaded Hourly Cot Hours Per Year Cot Per Hourly Employee Number of Hourly Workers Total Hourly Labor Cost 300 24.59 2545 23.75 2295 2000 22.17 21.42 2000 2070 35% 2000 2000 2000 2000 2000 47 507 2000 2000 2000 2000 s2672 S4516 s0,991 49,170 618 45,901 582 4434 42849 41,400 473 40,000 450 19.5709 618 618 618 618 S09 32,561.1 33.700.7 31,460.0 30,3961 29,368.2 26706.0 24190.2 21,814.0 150000 35,445.2 33.088.5 34246.64 30885 31,9696 25.174.8 25,254.6 20,233.3 22,8424 18,640.0 Tetal Laber Cost 78% 78% 78% 78% 78% 78% 78% 78% 78% 78% Selling, Ceneral & Administeative/Revenue Working Capial Assmptions 2) Das Sales Ountanding Das Sales Inverory Days Payable Ountanding 47 6x 47 47 6 47 6s 47 37 342x 476w 47,6 47 fo 47 6s 37 342 37 37 37 37 342 37.6 37 34 2 37.6 37 6x 34.2x 34 2 342 342 342 342 (a) Note that accounts receivable less accounts payable will be returned at the end of the project Also note that all working capital ratios ane baned on a 360 day year. Caed on bintorical averages w Type here to search prt sc 44 dek C 3 4 6 8 bac T Y U P D F G H J K L n 53 i C 7 5 LL 108% / 11 10 Q 4021 1 Hansson Private Label, Inc: Evaluating an Investment in Expansion : Comparable Company Analysis Net Book Market Net Enterprise Equity Value EBITDA EBIT Income Value Debt Value Beta Revenue Company Cathleen Sinclair 1,329.6 1,628.5 2.22 255.3 163.4 21.5 (1,112.8) 1,3468 298.9 446.1 General Health & Beauty Women's Care Company Skin Care Enterpeises 1,95 61.9 51.9 23.8 204.2 319.3 63.1 382.4 553 553.9 1.14 3073 52.7 49.3 770 43.7 498.6 1.35 155.8 125.4 316.2 1,204.2 371.9 1,576.1 1,2476 65.3 EBITDA Company EBIT Eamings 16% 12.1% P/B Revenue EBITDA EBIT Cathleen Sinclair 19.0% 6.4s 13.9% 12s 10.0% NM General Health & Beauty Women's Care Company Skin Care Enterprises Average 13.9% 11.6% 13.4 5.3% 09% 6.2 74x 16 13.3% 124% 194% 1.4s 10,5 11.2 6.5 11.4s 125% 14.6% 10.1% 52% 7.9 % 13x 101x 12.6 184s 3.8x 11.6% 12s 8.3 10.3x 13.1x 5,6x Type here to search prt sc 4 5 7 C W E R T Y D H J K L LO LL a 108% 11 /11 Hansson Private Label, Inc.: Evaluating an Investment in Expansion I 4021 Exhibit 7: Cost of Capital Analysis Debt Debt Equity Beta Debt Asset Beta Equity 444.9% Company: Value Beta Cathleen Sinclair 81.6% 2.22 0.25 0.79 General Health & Beauty Women's Care Company Skin Care Enterprises Average 16.5% 19.8% 1.95 0.00 1.74 10.0% 11.1% 30.9% 1.14 0.00 1.07 23.6% 135 0.00 1.14 32.9% 49.1% 1.67 0.06 1.18 Debt Debt Equity 0.0% Asset Equity Cost of Cost of Value Beta Beta Equity Debt WACC 0,0% 1.18 1.18 9,67% 7.75% 9.67% 5,0% 5.3% 1.18 1.22 9.86% 7.75% 7.75% 9,60% 10.0% 11.1% 17.6% 25.0% 33.3% 10.07 % 1.18 1.26 9.53% 15.0% 1.18 1.31 10.30% 7.75% 9,45% 20.0% 1.18 1.36 10.56% 7.75% 7.75% 9.38% 25P 1.18 1.42 10.86% 931% Assumptions 10-Year Treasury Market Risk Premisum 3.75% 5.00% Tax Rate 40,0% Type here to search 40 prt sc % 5 2 4 6 7 N E R T U D F G H J K L O e T (r ... 108 % (+ 11/11 9.31% 7.757 TU86% TAZ 33.3% T.18 Assumptions: 3.75% 10-Year Treasury 5.00% Market Risk Premium 40.0 % Tax Rate Est. Hansson EBITDA Multiple Est. Hansson Enterprise Value 7.0x 514.5 Existing Net Debt Plus: New Expansion Debt Total Estimated Debt 49.8 57.8 107.6 Existing D/V Estimated New D/V 97% 20.9% Assumed Debt Beta 0,00 Estimated Cost of Debti 7.75% O Type here to search hp prt sc % 3 5 6 7 C E T Y U D F H J K L C LO 3 11 h manufacturer profits per unit ll known (e.g., Crest toothpaste). Wit 0% lower than with branded products. Given unit sold despite lower selling prices. Gaining fur and prices remained a huge opportunity for retailers, as in many product categories. In the $21.6 billion personal accounted for $4 billion of sales at retail (less than 19% ) , which trafa sales from the manufacturers. Hansson estimated that HPL had a little total (see Exhibit 4, which shows HPL's sales into its retail channels). Investment Proposal The investment proposal in Hansson's hands included the following elements: Cost Components Depr. S 500 2000 1,500 Amount Est. Life Facility Expansion Manufacturing Equipment Packaging Equipment Working Capital Total Investment $10,000 20.000 15,000 12812 20yrs. 10yrs 10yrs $57,817 $4,000 The increase in wo g capital is not espected to occur up front at the time of the initial investment. It is assumed to take place throughout the year and should be considered as part of the 2009 cash flows Note: Working capital is defined as accounts receivable plus inventory less accounts payable and accrued expenses. At the end of the project, working capital will be returned in an amount equal to accounts receivable less accounts Fayable. The team that developed the proposal was led by Robert Gates, HPL's Executive Vice President of wl a Oo e here to search hp 4021 1 Hansson Private Label, Inc: Evaluating an Investment in Expansion Exhibit 1: HPL's Historical Financial Statements Operating Results 2003 2004 2005 2006 2007 Revenue $503.4 $543.7 $587.2 $636.1 $680.7 558.2 Less: Cost of Goods Sold 405.2 432.3 496.2 513.4 Gross Profit 98.2 111.4 91.0 45.8 122.7 122.5 Less: Selling, General & Administrative EBITDA Less: Depreciation EBIT Less: Interest Expense 37.8 44.6 51.5 49.0 60.4 6,8 66,8 45.2 71.2 73.5 6.2 6.0 5.9 6.1 53,6 60,6 39.2 65.3 67.4 5.5 5.8 5.9 5.3 3.3 EBT Less: Taxes Net Income 48.1 54.8 33.3 60.0 64.1 19.2 22.0 13.3 24.0 25.6 $28.9 $32.8 $20,0 $36,0 $38.5 Margins NA Revenue Grow th Gross Margin Selling, General & Administrative/Revenue FBITDA Margin EBIT Margin Net Income Margin Effective Tax Rate 8.0% 8.0% 8.3% 70% 19.5% 20.5% 19.3 % 15.5% 18.0% 75% 12.0% 8.2% 7.8% 8.1% 7.2% 77 % 12.3% 11.2% 10.3 % 5.7% 40.0% 10.8% 10.6% 11.1% 67 % 34% 5.7% 6.0% 57% 39.9% 40.1% 39 9% 39 0% Type here to search hp 144 # 3 % 2 4 6 U 1P l inl T LC 5.7% 5.7% 3.4% 6.0% 5.7% Net Income Margin Effective Tax Rate 39,9% 39.9% 40.0% 40.1 % 39.9% 2007 2005 2006 2004 2003 Assets Cash & Cash Equivalents $7.8 $5.1 $5.0 $4.8 $4.3 93.3 78.8 87.1 62.1 57.7 70.1 Accounts Receivable 61.2 67.3 58.0 61.9 Inventory Total Current Assets 133.2 165.6 124.1 144.8 156,8 201.4 202.9 203.1 202.3 204.4 Property, Plant & Equipment Other Non-Current Assets Total Assets 12.3 12.1 11.8 12.5 10.8 $337.8 $348.2 $359.7 $371.6 $380.8 Liabilities & Owners' Equity: Accounts Payable & Accrued Liabilities. $42.2 $45.0 $51.6 $53.4 $58.1 Long-Term Debt 91.6 82.8 73.8 65.8 54.8 Owners' Equity Total Liabilities & Owners' Equity 204.0 220.4 252.4 234.3 267.9 $337.8 $371.6 $348.2 $359.7 $380.8 Net Working Capital Accounts Receivable Plus: Inventory Less: Accounts Payable & Accrued Expenses Net Working Capital 62.1 70.1 78.8 87.1 93.3 57.7 58.0 61.2 61.9 67.3 422 45.0 51.6 53.4 58.1 77.6 83.1 88.4 95.6 102.5 (Exltibit 1 cont'd mext page) Type here to search hp 144 $3 % 4 5 6 7 E R Y T O Hansson Private Label, Inc.: Evaluating an Investment in Expansion Exhibit 1, cont'd 2007 2004 2005 2006 2003 Cash From Operations: $36.0 5.9 $20.0 6.0 8.7 3.2 $38.5 6.1 $32.8 6.2 $28.9 6.8 Net Income Plus: Depreciation Less: Increase in Accounts Receivable Less: Increase in Inventory Plus: Increase in Accounts Payable Total Cash From Operations 8.3 6.2 5.4 8.0 3.1 07 0.3 0.5 18 $34.7 6.6 2.8 4.7 $37.7 0.3 $32.4 $33.5 $20.7 Cash Erom Inesting Capital Expenditures Plus: Increases in Other Non-Current Assets Total Cash Used in Investing $7.7 (0.2) $7.5 $6.2 (0.3) $5.1 0.7 $8.2 $7.3 (1.7) 0.5 $5,9 $5.8 $6.5 $7.8 Cash Erom Financing Repayment of Debt Plus Dividend Payments Cash Used in Financing $8.0 $8.8 16.4 $9.0 S8.0 $11.0 6.1 14.4 17.9 23.0 $22.4 $25.2 $15.1 $25,9 $34.0 Total Cash Generated $2.2 S0.8 (S0.3) $3,0 (S2,81 Type here to search hp 144 # % 4 5 6 7 8 E R T T00 A 4021 I Hansson Private Label, Inc: Evaluating an Investment in Expansion Exhibit 2: Private Label Share of U.S. Consumer Packaged-Goods Spending Dollar share Unit share 25% 21.3% 21.2% 21.0% 20% 16.1% 15.8% 15.7% 15% 10% 5% 0% 2005 2006 2007 Source IRI Exhibit 3: US. Sales in HPL's Target Markets (in USS millions) Type here to search a hp 4+ 144 & 4 5 6 7 E R LO 108% 8 /11 Source: IRI Exhibit 3: U.S. Sales in HPL's Target Markets (in US$ millions) Personal hygiene Skin care Oral hygiene Hand and body care $24.000 $21,000 $2,229 $2,151 $2,071 $1.990 $1,909 $18.000 $4,417 $4,397 $4,374 $4.352 $4.328 $15,000 $12,000 S6471 $9.000 $6,000 $7,100 $7.400 $7.700 $8.300 $8.000 $3.000 50 2003 2004 2005 2006 2007 Source: Datamonitor Note: These figures include sales of both branded and private label products. ) Type here to search hp 144 3 4 6 7 8 LO Q 108 % /11 Exhibit 4: HPL's Sales into Its Retail Channels Figures represent wholesale prices. Sales (US$ millions) for Year Ending December 31 Channel 2003 2004 2005 2006 2007 Mass merchants 170 193 220 247 268 Grocery 91 92 92 92 Club 136 141 149 159 167 Drug 55 60 66 73 80 Dollar 22 24 26 29 32 All others 31 33 34 37 40 Total 505 543 587 637 681 The category "All others" comprises convenience store sales and sales to miscellaneous distributors. Exhibit 5: Excerpt of Financial Assumptions in Capital Request Form Re Proe Toal Capadty 0s 2009 2000 2011 2012 2013 2014 2015 2016 2017 2018 s000 650% 000 80000 Capacity Uslation Unit Velume- Sellne Price Per Un-Crowing an 80000 82000 600 200% 5600 750% 80.0% 64.000 850% 68.000 850% 850% 85 850% s2000 4e000 68 000 68.000 68000 20m 68.00 17 181 91,881 184 188 192 Ravesne 195 132 882 196 203 207 212 143,84 101.124 11290 122.618 135545 138 756 141.021 Prowtion Co Raw Materials Pee Un Ce ng at 1% Manudactureg Orehead Ceoing Marnance Espense Cewing 10 out 0 30% 1.00 10 4428 3600 3208 2338 102 460 10 3810 3804 4052 4.171 42 2200 2307 24 2512 2608 2687 2767 2850 2906 Type here to search 144 prt s 5 6 7 bact T U D F G J K L e 8 108% 9 11 143,41 141,021 138.256 15.545 132A87 122618 112,700 10,124 93,881 84960 Revenoe 103 102 1,01 1.00 Praduction Costs Raw Materials Per Unit Crowing at 1 % 10 %. Manufacturing Overhead Crowing at Maintonance Experse Crowing at 099 098 097 096 4.697 095 4,560 0.94 4,428 4,299 4.173 4052 3,904 2,459 3819 3208 2,318 2936 3600 2,850 3.0% 2767 2687 2608 2532 2387 2,250 30% Saleriel Labor Cost Managers Average Aneual Felly Loaded Cost Total Salaried Labor Cost 6 4 218.1 2107 2016 1967 1900 183.6 177A 1714 165.6 1600 35% 1.744.5 1,685.5 1628.5 1573.4 1520.2 1,0644 1,4688 1.028.4 6624 640.0 27,26 2634 Harly Labor Cot Average Fully Lcaded Hourly Cot Hours Per Year Cot Per Hourly Employee Number of Hourly Workers Total Hourly Labor Cost 300 24.59 2545 23.75 2295 2000 22.17 21.42 2000 2070 35% 2000 2000 2000 2000 2000 47 507 2000 2000 2000 2000 s2672 S4516 s0,991 49,170 618 45,901 582 4434 42849 41,400 473 40,000 450 19.5709 618 618 618 618 S09 32,561.1 33.700.7 31,460.0 30,3961 29,368.2 26706.0 24190.2 21,814.0 150000 35,445.2 33.088.5 34246.64 30885 31,9696 25.174.8 25,254.6 20,233.3 22,8424 18,640.0 Tetal Laber Cost 78% 78% 78% 78% 78% 78% 78% 78% 78% 78% Selling, Ceneral & Administeative/Revenue Working Capial Assmptions 2) Das Sales Ountanding Das Sales Inverory Days Payable Ountanding 47 6x 47 47 6 47 6s 47 37 342x 476w 47,6 47 fo 47 6s 37 342 37 37 37 37 342 37.6 37 34 2 37.6 37 6x 34.2x 34 2 342 342 342 342 (a) Note that accounts receivable less accounts payable will be returned at the end of the project Also note that all working capital ratios ane baned on a 360 day year. Caed on bintorical averages w Type here to search prt sc 44 dek C 3 4 6 8 bac T Y U P D F G H J K L n 53 i C 7 5 LL 108% / 11 10 Q 4021 1 Hansson Private Label, Inc: Evaluating an Investment in Expansion : Comparable Company Analysis Net Book Market Net Enterprise Equity Value EBITDA EBIT Income Value Debt Value Beta Revenue Company Cathleen Sinclair 1,329.6 1,628.5 2.22 255.3 163.4 21.5 (1,112.8) 1,3468 298.9 446.1 General Health & Beauty Women's Care Company Skin Care Enterpeises 1,95 61.9 51.9 23.8 204.2 319.3 63.1 382.4 553 553.9 1.14 3073 52.7 49.3 770 43.7 498.6 1.35 155.8 125.4 316.2 1,204.2 371.9 1,576.1 1,2476 65.3 EBITDA Company EBIT Eamings 16% 12.1% P/B Revenue EBITDA EBIT Cathleen Sinclair 19.0% 6.4s 13.9% 12s 10.0% NM General Health & Beauty Women's Care Company Skin Care Enterprises Average 13.9% 11.6% 13.4 5.3% 09% 6.2 74x 16 13.3% 124% 194% 1.4s 10,5 11.2 6.5 11.4s 125% 14.6% 10.1% 52% 7.9 % 13x 101x 12.6 184s 3.8x 11.6% 12s 8.3 10.3x 13.1x 5,6x Type here to search prt sc 4 5 7 C W E R T Y D H J K L LO LL a 108% 11 /11 Hansson Private Label, Inc.: Evaluating an Investment in Expansion I 4021 Exhibit 7: Cost of Capital Analysis Debt Debt Equity Beta Debt Asset Beta Equity 444.9% Company: Value Beta Cathleen Sinclair 81.6% 2.22 0.25 0.79 General Health & Beauty Women's Care Company Skin Care Enterprises Average 16.5% 19.8% 1.95 0.00 1.74 10.0% 11.1% 30.9% 1.14 0.00 1.07 23.6% 135 0.00 1.14 32.9% 49.1% 1.67 0.06 1.18 Debt Debt Equity 0.0% Asset Equity Cost of Cost of Value Beta Beta Equity Debt WACC 0,0% 1.18 1.18 9,67% 7.75% 9.67% 5,0% 5.3% 1.18 1.22 9.86% 7.75% 7.75% 9,60% 10.0% 11.1% 17.6% 25.0% 33.3% 10.07 % 1.18 1.26 9.53% 15.0% 1.18 1.31 10.30% 7.75% 9,45% 20.0% 1.18 1.36 10.56% 7.75% 7.75% 9.38% 25P 1.18 1.42 10.86% 931% Assumptions 10-Year Treasury Market Risk Premisum 3.75% 5.00% Tax Rate 40,0% Type here to search 40 prt sc % 5 2 4 6 7 N E R T U D F G H J K L O e T (r ... 108 % (+ 11/11 9.31% 7.757 TU86% TAZ 33.3% T.18 Assumptions: 3.75% 10-Year Treasury 5.00% Market Risk Premium 40.0 % Tax Rate Est. Hansson EBITDA Multiple Est. Hansson Enterprise Value 7.0x 514.5 Existing Net Debt Plus: New Expansion Debt Total Estimated Debt 49.8 57.8 107.6 Existing D/V Estimated New D/V 97% 20.9% Assumed Debt Beta 0,00 Estimated Cost of Debti 7.75% O Type here to search hp prt sc % 3 5 6 7 C E T Y U D F H J K L C LO
Step by Step Solution
There are 3 Steps involved in it

Get step-by-step solutions from verified subject matter experts