

Question: Evaluating Grocery Stores Using Efficiency Ratios Below are data for three publicly traded grocery stores that range in size from local (Village Super Markets) to
Evaluating Grocery Stores Using Efficiency Ratios
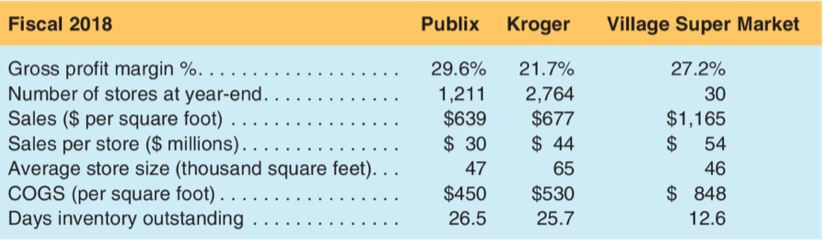
Below are data for three publicly traded grocery stores that range in size from local (Village Super Markets) to regional (Publix) to national (Kroger). Use the ratios below to answer the requirements. Assume that the companies sell roughly the same mix of products and face about the same inventory costs
.
a. On average, which company has the freshest food?
b. Which company is least efficient with its space?
c. Which company has the lowest prices?
d. Which company is busiest?
e. Which company has the smallest stores?
Fiscal 2018 Publix Kroger Village Super Market . . Gross profit margin %. Number of stores at year-end. Sales ($ per square foot) .. Sales per store ($ millions). Average store size (thousand square feet). . . COGS (per square foot).... Days inventory outstanding 29.6% 1,211 $639 $ 30 47 $450 26.5 21.7% 2,764 $677 $ 44 65 $530 25.7 27.2% 30 $1,165 $ 54 46 $ 848 12.6
Step by Step Solution
There are 3 Steps involved in it

Get step-by-step solutions from verified subject matter experts