

Question: Evaluating Reports MC The dot plot below shows the number of hours of sleep preferred by 25 patients chosen randomly in a particular medical office

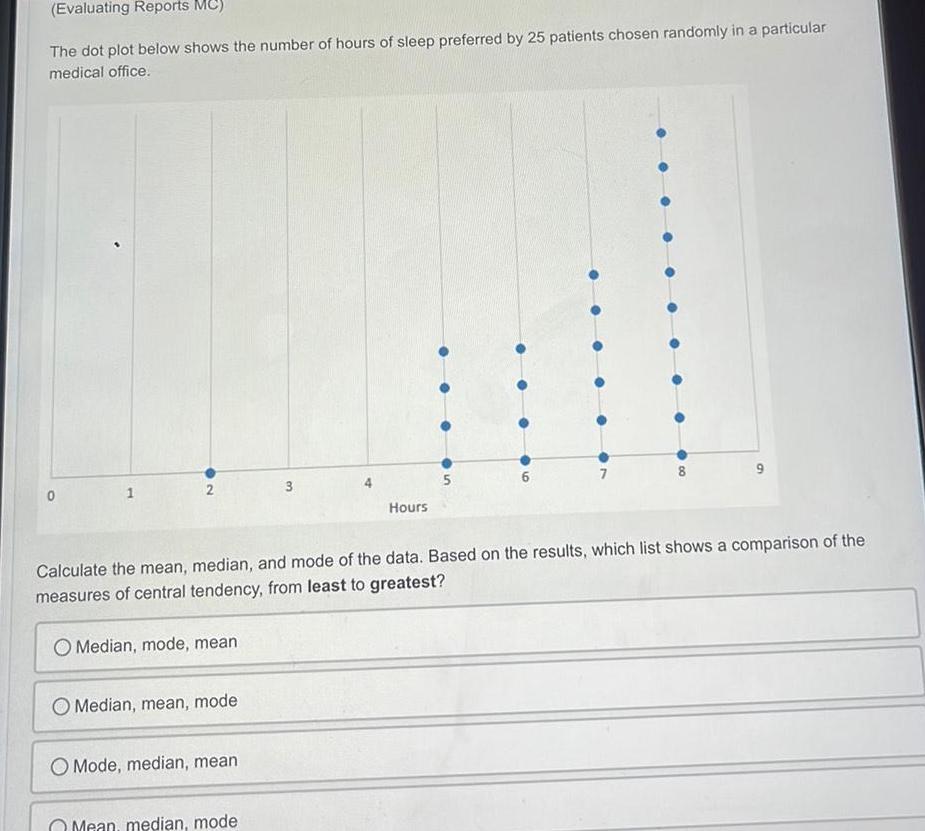
Evaluating Reports MC The dot plot below shows the number of hours of sleep preferred by 25 patients chosen randomly in a particular medical office 1 2 O Median mode mean Median mean mode O Mode median mean 3 Calculate the mean median and mode of the data Based on the results which list shows a comparison of the measures of central tendency from least to greatest Mean median mode Hours 5 00
Step by Step Solution
There are 3 Steps involved in it
1 Expert Approved Answer
Step: 1 Unlock

Question Has Been Solved by an Expert!
Get step-by-step solutions from verified subject matter experts
Step: 2 Unlock
Step: 3 Unlock