

Question: Evaluating Risk & Return: Please help with the following Bartman Industries's and Reynolds Inc.s stock prices and dividends, along with the Winslow 5000 Index, are
Evaluating Risk & Return:
Please help with the following
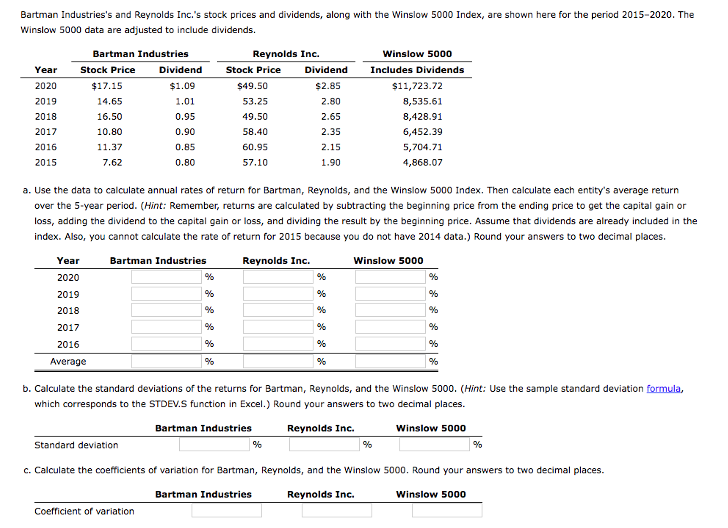
Bartman Industries's and Reynolds Inc."s stock prices and dividends, along with the Winslow 5000 Index, are shown here for the period 2015 -2020. The Winslow 5000 data are adjusted to include dividends. a. Use the data to calculate annual rates of return for Bartman, Reynolds, and the Winslow 5000 Index. Then calculate each entity's average return over the 5-year period. (Hint: Remember, returns are calculated by subtracting the beginning price from the ending price to get the capital gain or loss, adding the dividend to the capital gain or loss, and dividing the result by the beginning price. Assume that dividends are already included in the index. Also, you cannot calculate the rate of return for 2015 because you do not have 2014 data.) Round your answers to two decimal places. b. Calculate the standard deviations of the returns for Bartman, Reynolds, and the Winslow 5000. (Hint: Use the sample standard deviation formula, which corresponds to the STDEV.S function in Excel.) Round your answers to two decimal places
Step by Step Solution
There are 3 Steps involved in it

Get step-by-step solutions from verified subject matter experts