

Question: Evaluating the Design of a Data Dashboard. An alternative version of the Espl ndido Jugo y Batido data dashboard shown in Figure 8 . 1
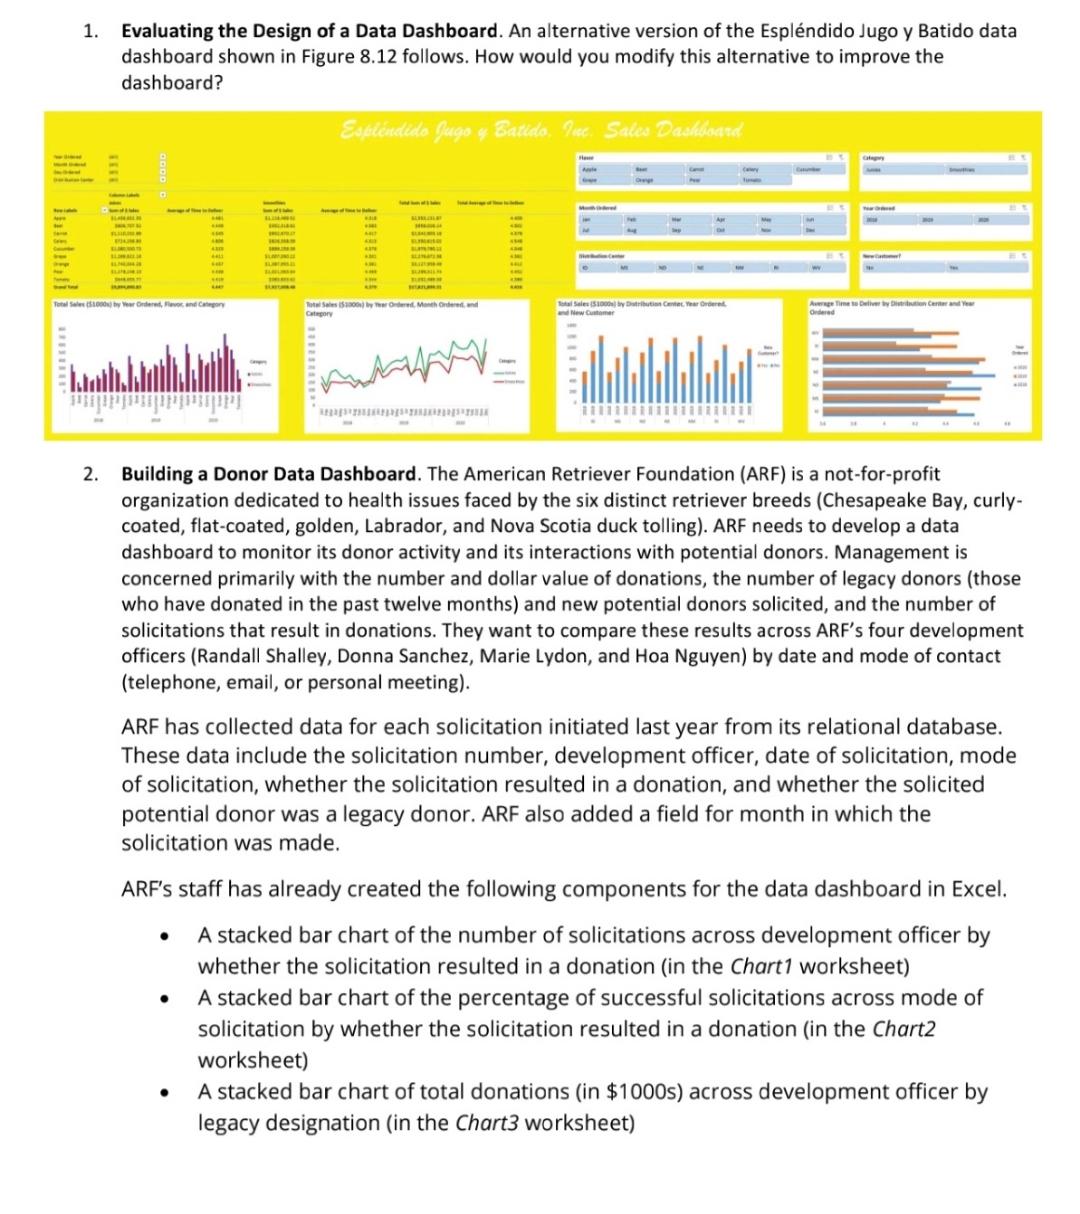
Evaluating the Design of a Data Dashboard. An alternative version of the Esplndido Jugo y Batido data dashboard shown in Figure follows. How would you modify this alternative to improve the dashboard?
Building a Donor Data Dashboard. The American Retriever Foundation ARF is a notforprofit organization dedicated to health issues faced by the six distinct retriever breeds Chesapeake Bay, curlycoated, flatcoated, golden, Labrador, and Nova Scotia duck tolling ARF needs to develop a data dashboard to monitor its donor activity and its interactions with potential donors. Management is concerned primarily with the number and dollar value of donations, the number of legacy donors those who have donated in the past twelve months and new potential donors solicited, and the number of solicitations that result in donations. They want to compare these results across ARF's four development officers Randall Shalley, Donna Sanchez, Marie Lydon, and Hoa Nguyen by date and mode of contact telephone email, or personal meeting
ARF has collected data for each solicitation initiated last year from its relational database. These data include the solicitation number, development officer, date of solicitation, mode of solicitation, whether the solicitation resulted in a donation, and whether the solicited potential donor was a legacy donor. ARF also added a field for month in which the solicitation was made.
ARF's staff has already created the following components for the data dashboard in Excel.
A stacked bar chart of the number of solicitations across development officer by whether the solicitation resulted in a donation in the Chart worksheet
A stacked bar chart of the percentage of successful solicitations across mode of solicitation by whether the solicitation resulted in a donation in the Chart worksheet
A stacked bar chart of total donations in $ s across development officer by legacy designation in the Chart worksheet
Step by Step Solution
There are 3 Steps involved in it
1 Expert Approved Answer
Step: 1 Unlock

Question Has Been Solved by an Expert!
Get step-by-step solutions from verified subject matter experts
Step: 2 Unlock
Step: 3 Unlock