

Question: Evaluating the Menu The menu is often the most important tool influencing the success or failure of a food and beverage operation. But how should
Evaluating the Menu
The menu is often the most important tool influencing the success or failure of a
food and beverage operation. But how should menus be evaluated to determine
whether the mo popular approach to menu evaluation sold? The process of menu
engineering s menu item? There are two mion.
quently, and a praluated in terms of both their popularity and profitabilitin. Menu
items can be evalues engineering process uses information readily
Basically, the manager to classify menu items into four types available to
Starsitores items that are not profitable but are popular
Plowlesitems that are profitable but are not popular
Puzzlitems that are neither profitable nor popular
Dog classify each menu item, managers require a practical way to define and
measure the profitability and popularity of each menu item. This can be accom
plished by using information about precosted food costs and frequency of menu
item sales.
The basis of a menu item's profitability is not the level of its food cost, but
its contribution margin. Some managers assume one food item's lower food cost
percentage makes that item more profitable to sell than an item with a higher food
cost percentage, meaning the operation earns more from the sale of lower food
cost items. While this theory sounds good, it can be easily disproved. Consider the
following example:
In this example, chicken has the lower food cost percentage percent compared
to percent for steak According to the theory, the sale of chicken should help
the operation more than the sale of steak. However, as shown by the contribution
margin menu item selling price minus food cost only $ is left from the sale
of chicken to pay for all other costs and to make a contribution to the property's
profit requirements. In the case of steak, $ remains for this purpose. The higher
cost item may cost more, but it produces a larger contribution margin.
Information about frequency of sales for each menu item can be gathered by
tallying the number of each item sold during some specified time period, such
as two weeks. This information can be abstracted manually from guest checks
or more frequently, by analysis of unit sales information from the POS system.
Popular items have a relatively high menu mix percentage. Accordingly, "star"
year
service Yea
operations
seasonal locat
re much
revenue and
While using
lyze monthly
sider why the trend
March, August,
year. The manager
in January, Febr
how much of the
increase in selling
Exhibit Budget
Operating Budget
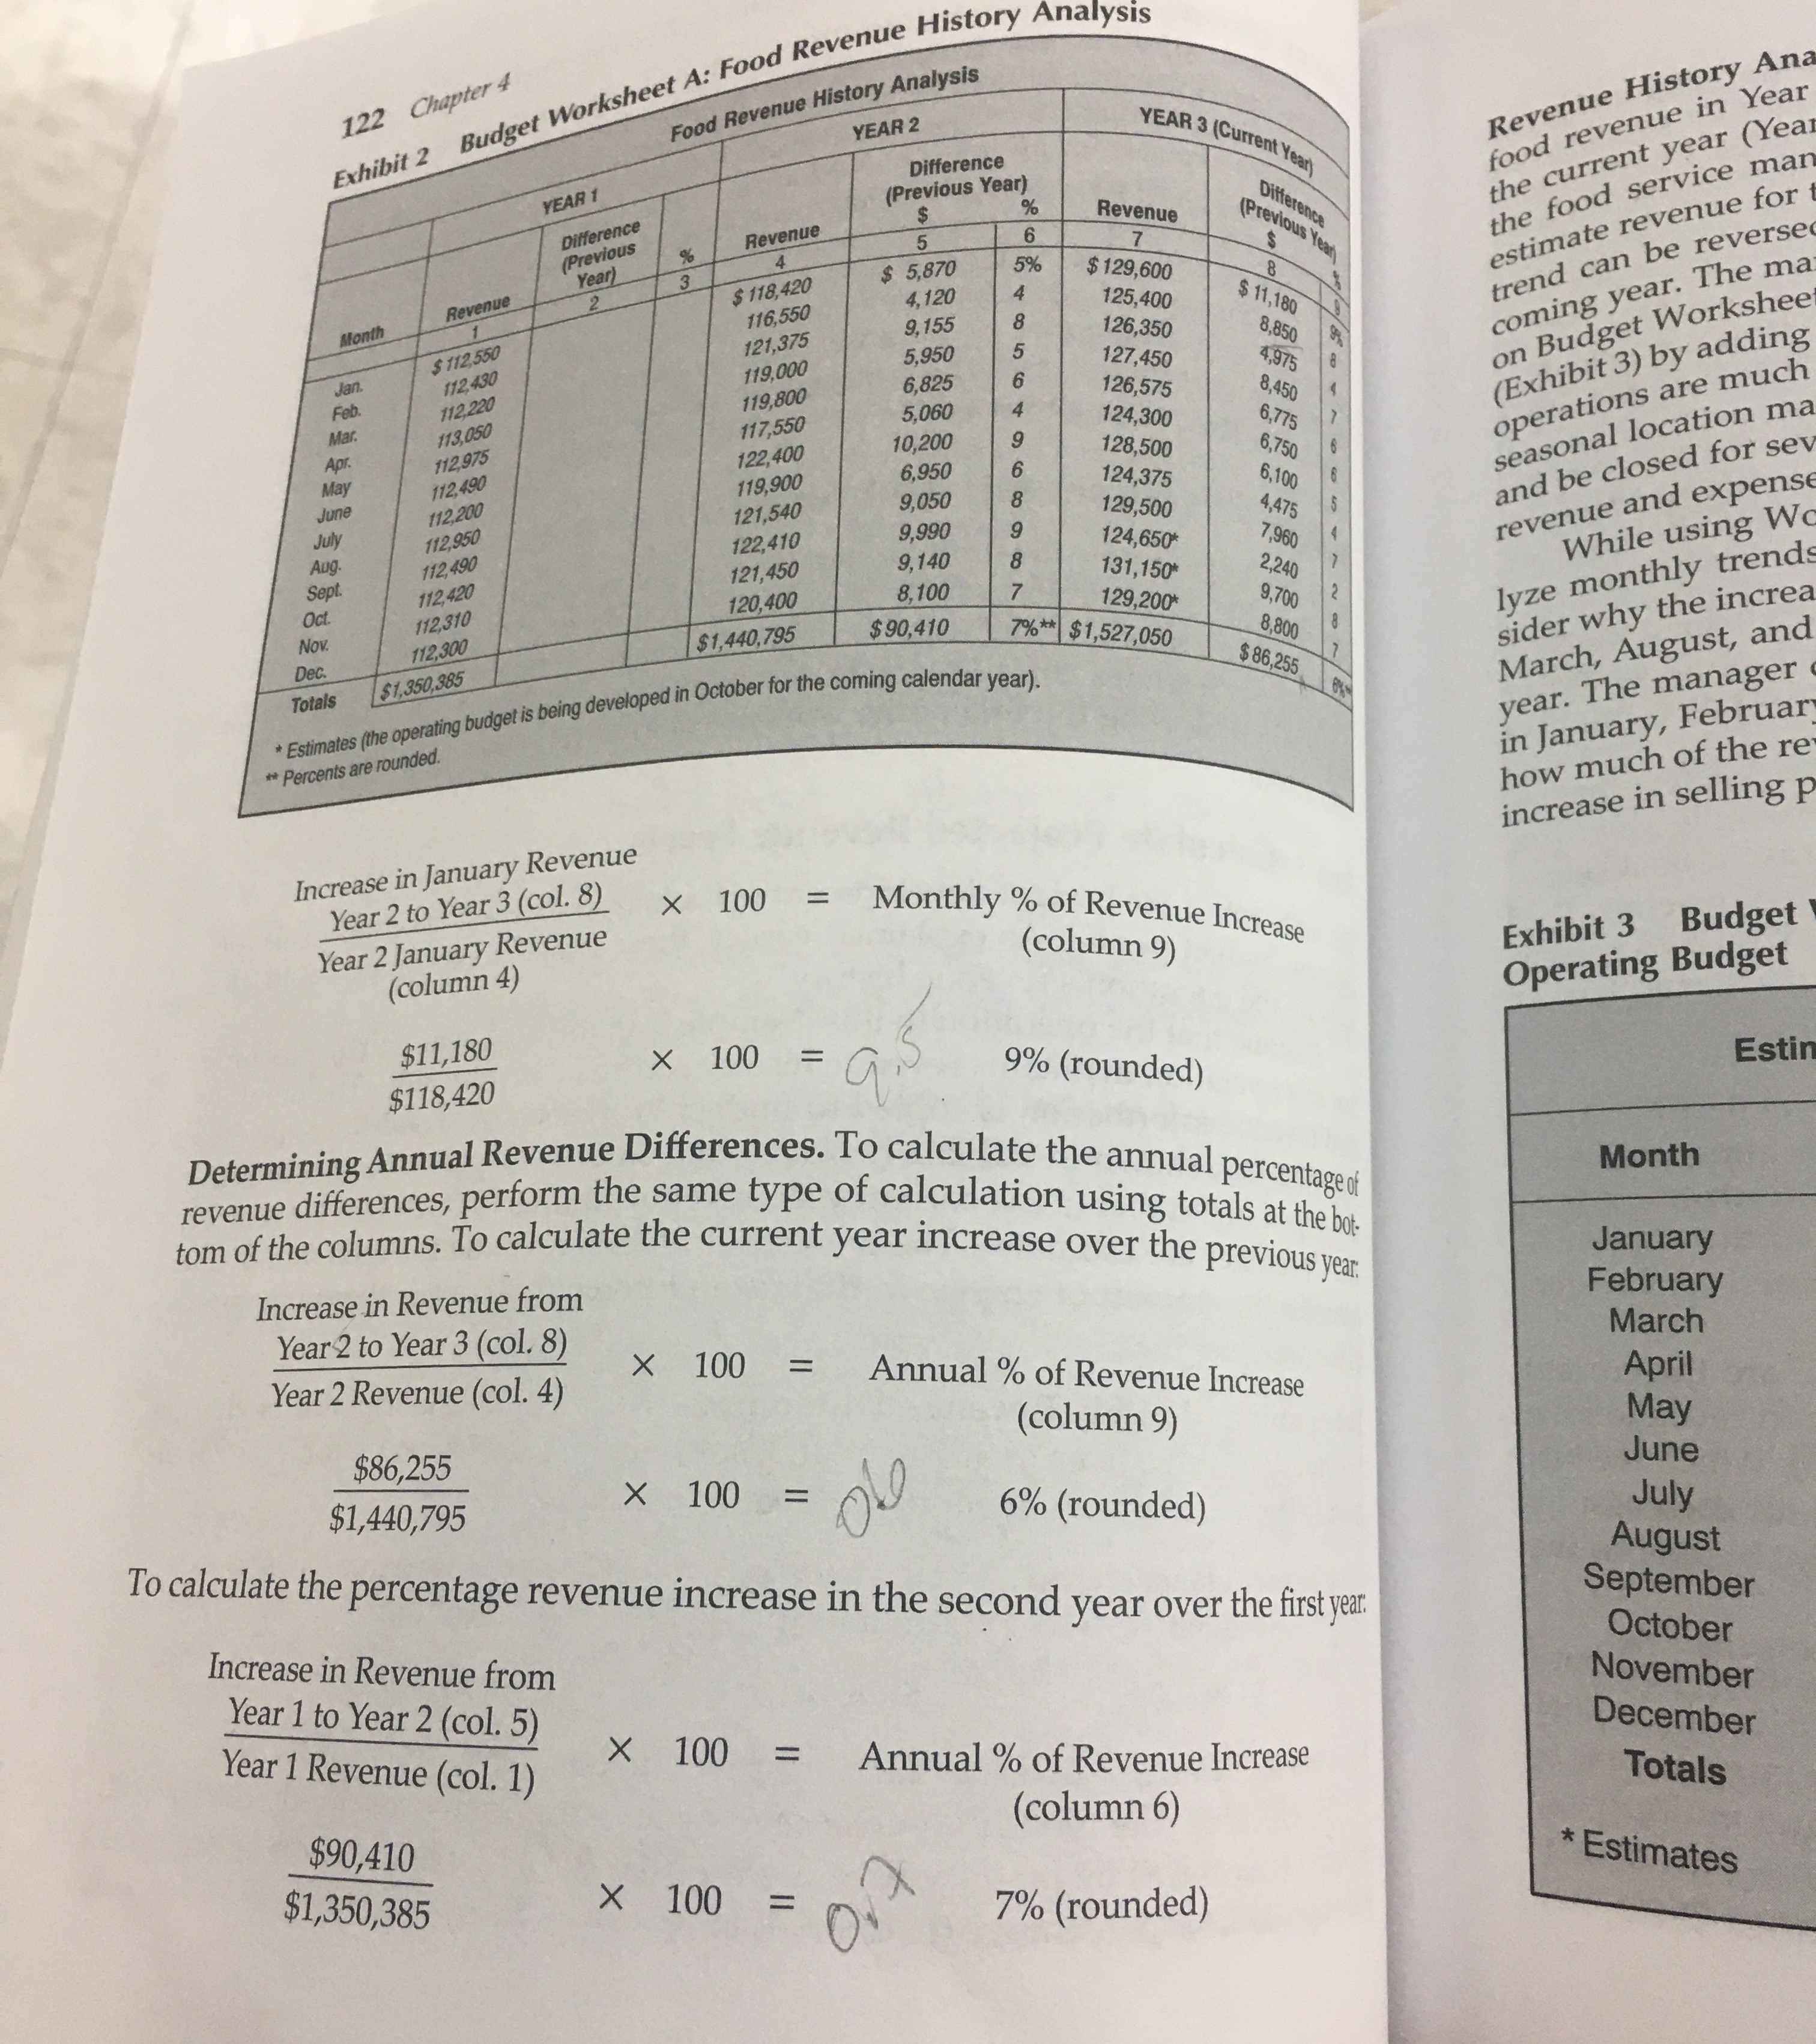
Determining Annual Revenue Differences. To calculate the annual percentageof
revenue differences, perform the same type of calculation using totals at the bo:
tom of the columns. To calculate the current year increase over the previous year:
To calculate the percentage revenue increase in the second year over the first ear:
Step by Step Solution
There are 3 Steps involved in it
1 Expert Approved Answer
Step: 1 Unlock

Question Has Been Solved by an Expert!
Get step-by-step solutions from verified subject matter experts
Step: 2 Unlock
Step: 3 Unlock