

Question: Evalute the financial preformance using ratios. x , fx -A B D E F G H 2005 2006 2007 2008 2009 48,405+ 25,373 3,968 21,405
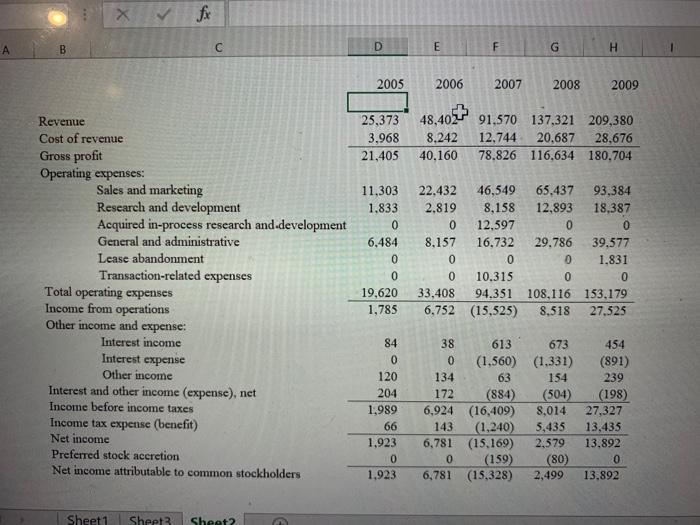
x , fx -A B D E F G H 2005 2006 2007 2008 2009 48,405+ 25,373 3,968 21,405 8,242 40,160 91,570 137,321 209,380 12,744 20.687 28,676 78.826 116,634 180,704 Revenue Cost of revenue Gross profit Operating expenses: Sales and marketing Research and development Acquired in-process research and development General and administrative Lease abandonment Transaction-related expenses Total operating expenses Income from operations Other income and expense: Interest income Interest expense Other income Interest and other income (expense), net Income before income taxes Income tax expense (benefit) Net income Preferred stock accretion Net income attributable to common stockholders 11,303 1.833 0 6.484 0 0 19,620 1,785 22.432 2.819 0 8.157 0 0 33,408 6.752 46,549 8,158 12.597 16.732 0 10.315 94.351 (15,525) 65.437 12,893 0 29.786 0 0 108,116 8.518 93,384 18,387 0 39,577 1,831 0 153.179 27.525 84 0 120 204 1,989 66 1,923 0 1,923 38 613 673 0 (1.560) (1,331) 134 63 154 172 (884) (504) 6,924 (16,409) 8,014 143 (1,240) 3,435 6,781 (15.169) 2.579 0 (159) (80) 6,781 (15,328) 2,499 454 (891) 239 (198) 27.327 13,435 13,892 0 13,892 Sheet1 Sheet3 Sheet2
Step by Step Solution
There are 3 Steps involved in it

Get step-by-step solutions from verified subject matter experts