

Question: Every year the assignment for the Systems Modelling and Simulation module has a different theme. For example, in the previous years the assignments had healthcare,
Every year the assignment for the Systems Modelling and Simulation module has a different theme. For example, in the previous years the assignments had healthcare, banking services, airports, and logistics themes. This year our assignment is about Manufacturing company. All this variation allows you to appreciate how this fundamental subject can be applied to different problems which fundamentally have similar performance indicators. Enjoy this years assignment!
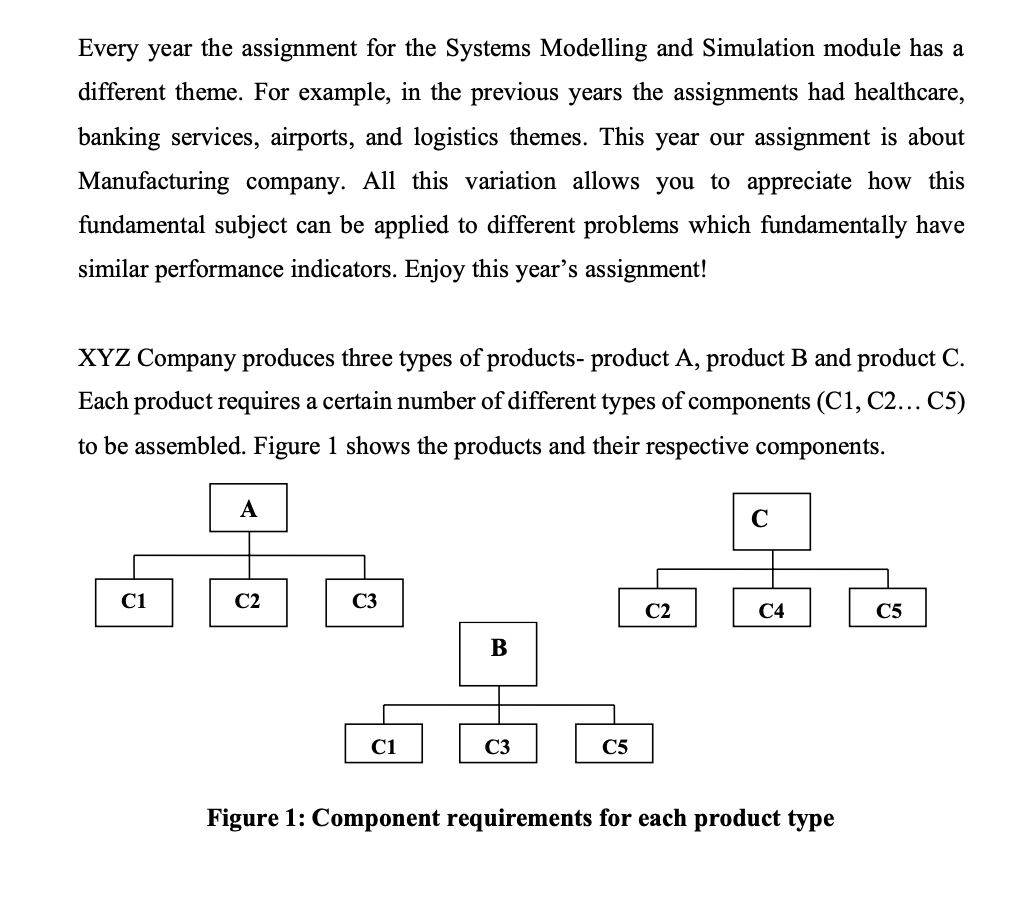
XYZ Company produces three types of products product A product B and product C Each product requires a certain number of different types of components C C C to be assembled. Figure shows the products and their respective components.
Figure : Component requirements for each product type
Components C to C are fed to the production line according to exponential distributions with parameters and all in minutes respectively. Assembling times are given by TRIA for A TRIA for B and TRIA for C
The plant layout consists of stations. Stations through are machining stations and each component has a separate processing sequence through these stations. Operation times at each machine are shown in table After various machining process, all components go to the fifth station which is the assembly station. Components are put together according to product type.
At each of the machine stations, the highest priority is given to the longest components that have been in the system.
Station has two assembly robots that may be selected at random, but one has failure problems. It breaks down periodically and historical data on these breakdowns have shown a mean uptime of exponential, lambda minutes. The time to repair also follows an exponential distribution with a mean of minutes. The system operates hours shift in a day. Transfer times between each two station is TRIA minutes.
Due to increase in demand, and the need to reduce production costs, the company is considering ways to effectively reduce WorkInProcess and reduce throughput times whilst maintaining a good level of resource utilisation. To achieve this, management wants to identify the bottleneck processes and increase their capacities if necessary.
As a systems analyst consulted by this company,
Develop a simulation model with appropriate animations of the production system. You may use the system layout in figure for your animation.
Identify the bottleneck process and propose alternative system improvement initiatives that will improve the performance factors listed. Model your proposed system and compare results for resource utilisation, WorkIn Process, throughput times and number out of each product type with the original system.
Discuss your improvements with reference to the original system in a written report to the management of the company. The report should present a strong case for your proposal and clearly show the values of the performance factors before and after your improvement you may want to use Arenas output analyser for your comparative studies Validate the results using statistical means see lecture notes and associated references
In addition, the company is considering installation of a conveyor system to transfer entities between stations. You are required to simulate the conveyor system nonAccumulating and find the best settings eg velocity that retains the appropriate resource utilisation but could reduce overall time entities remain in the system. Distances between Stations are:
From Station No To Station No Distance all in meters
Out
In
Use Run conditions defined as: Warmup Period minutes, Replication Length days and Number of Replication The system requires initialisation between replications. Decide on whether to initialise Statistics at Run replications and explain your reasoning why you have made the decision.
Figure Layout of the companys manufacturing system
Table Component routings and Process times all times are in minutes and are triangularly distributed
Sure, I'll create a table based on the provided information, and I'll also provide a diagram of the system layout.
### Table: Component Routings and Process Times
Components Station Time Station Time Station Time Station Time Station TimeAssembly
CAssembly
CAssembly
CAssembly
C
Step by Step Solution
There are 3 Steps involved in it
1 Expert Approved Answer
Step: 1 Unlock

Question Has Been Solved by an Expert!
Get step-by-step solutions from verified subject matter experts
Step: 2 Unlock
Step: 3 Unlock