

Question: The graph below is a plot of some of the level curves of a function g in a rectangular region R [.4, 5.8] x
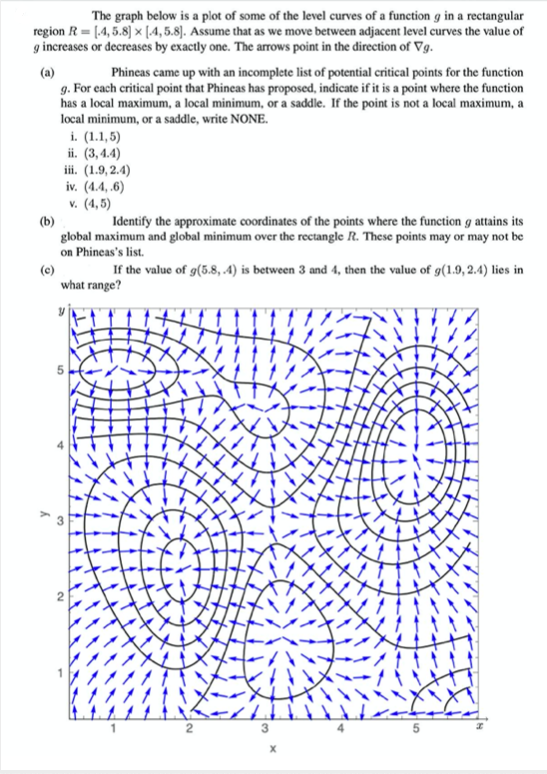
The graph below is a plot of some of the level curves of a function g in a rectangular region R [.4, 5.8] x [4,5.8]. Assume that as we move between adjacent level curves the value of g increases or decreases by exactly one. The arrows point in the direction of Vg. (a) Phineas came up with an incomplete list of potential critical points for the function g. For each critical point that Phineas has proposed, indicate if it is a point where the function has a local maximum, a local minimum, or a saddle. If the point is not a local maximum, a local minimum, or a saddle, write NONE. i. (1.1,5) ii. (3,4.4) iii. (1.9, 2.4) (b) (c) iv. (4.4,.6) v. (4,5) Identify the approximate coordinates of the points where the function g attains its global maximum and global minimum over the rectangle R. These points may or may not be on Phineas's list. If the value of g(5.8, .4) is between 3 and 4, then the value of g(1.9, 2.4) lies in what range? 2 3 x NIZZ
Step by Step Solution
There are 3 Steps involved in it
To solve the problem well analyze the level curves and the direction of a b l a g a b l a g as shown ... View full answer

Get step-by-step solutions from verified subject matter experts