

Question: Ex 1 . The following data represents the traffic volume counts that were made during a 2 - hour counting period. The day's peak hour
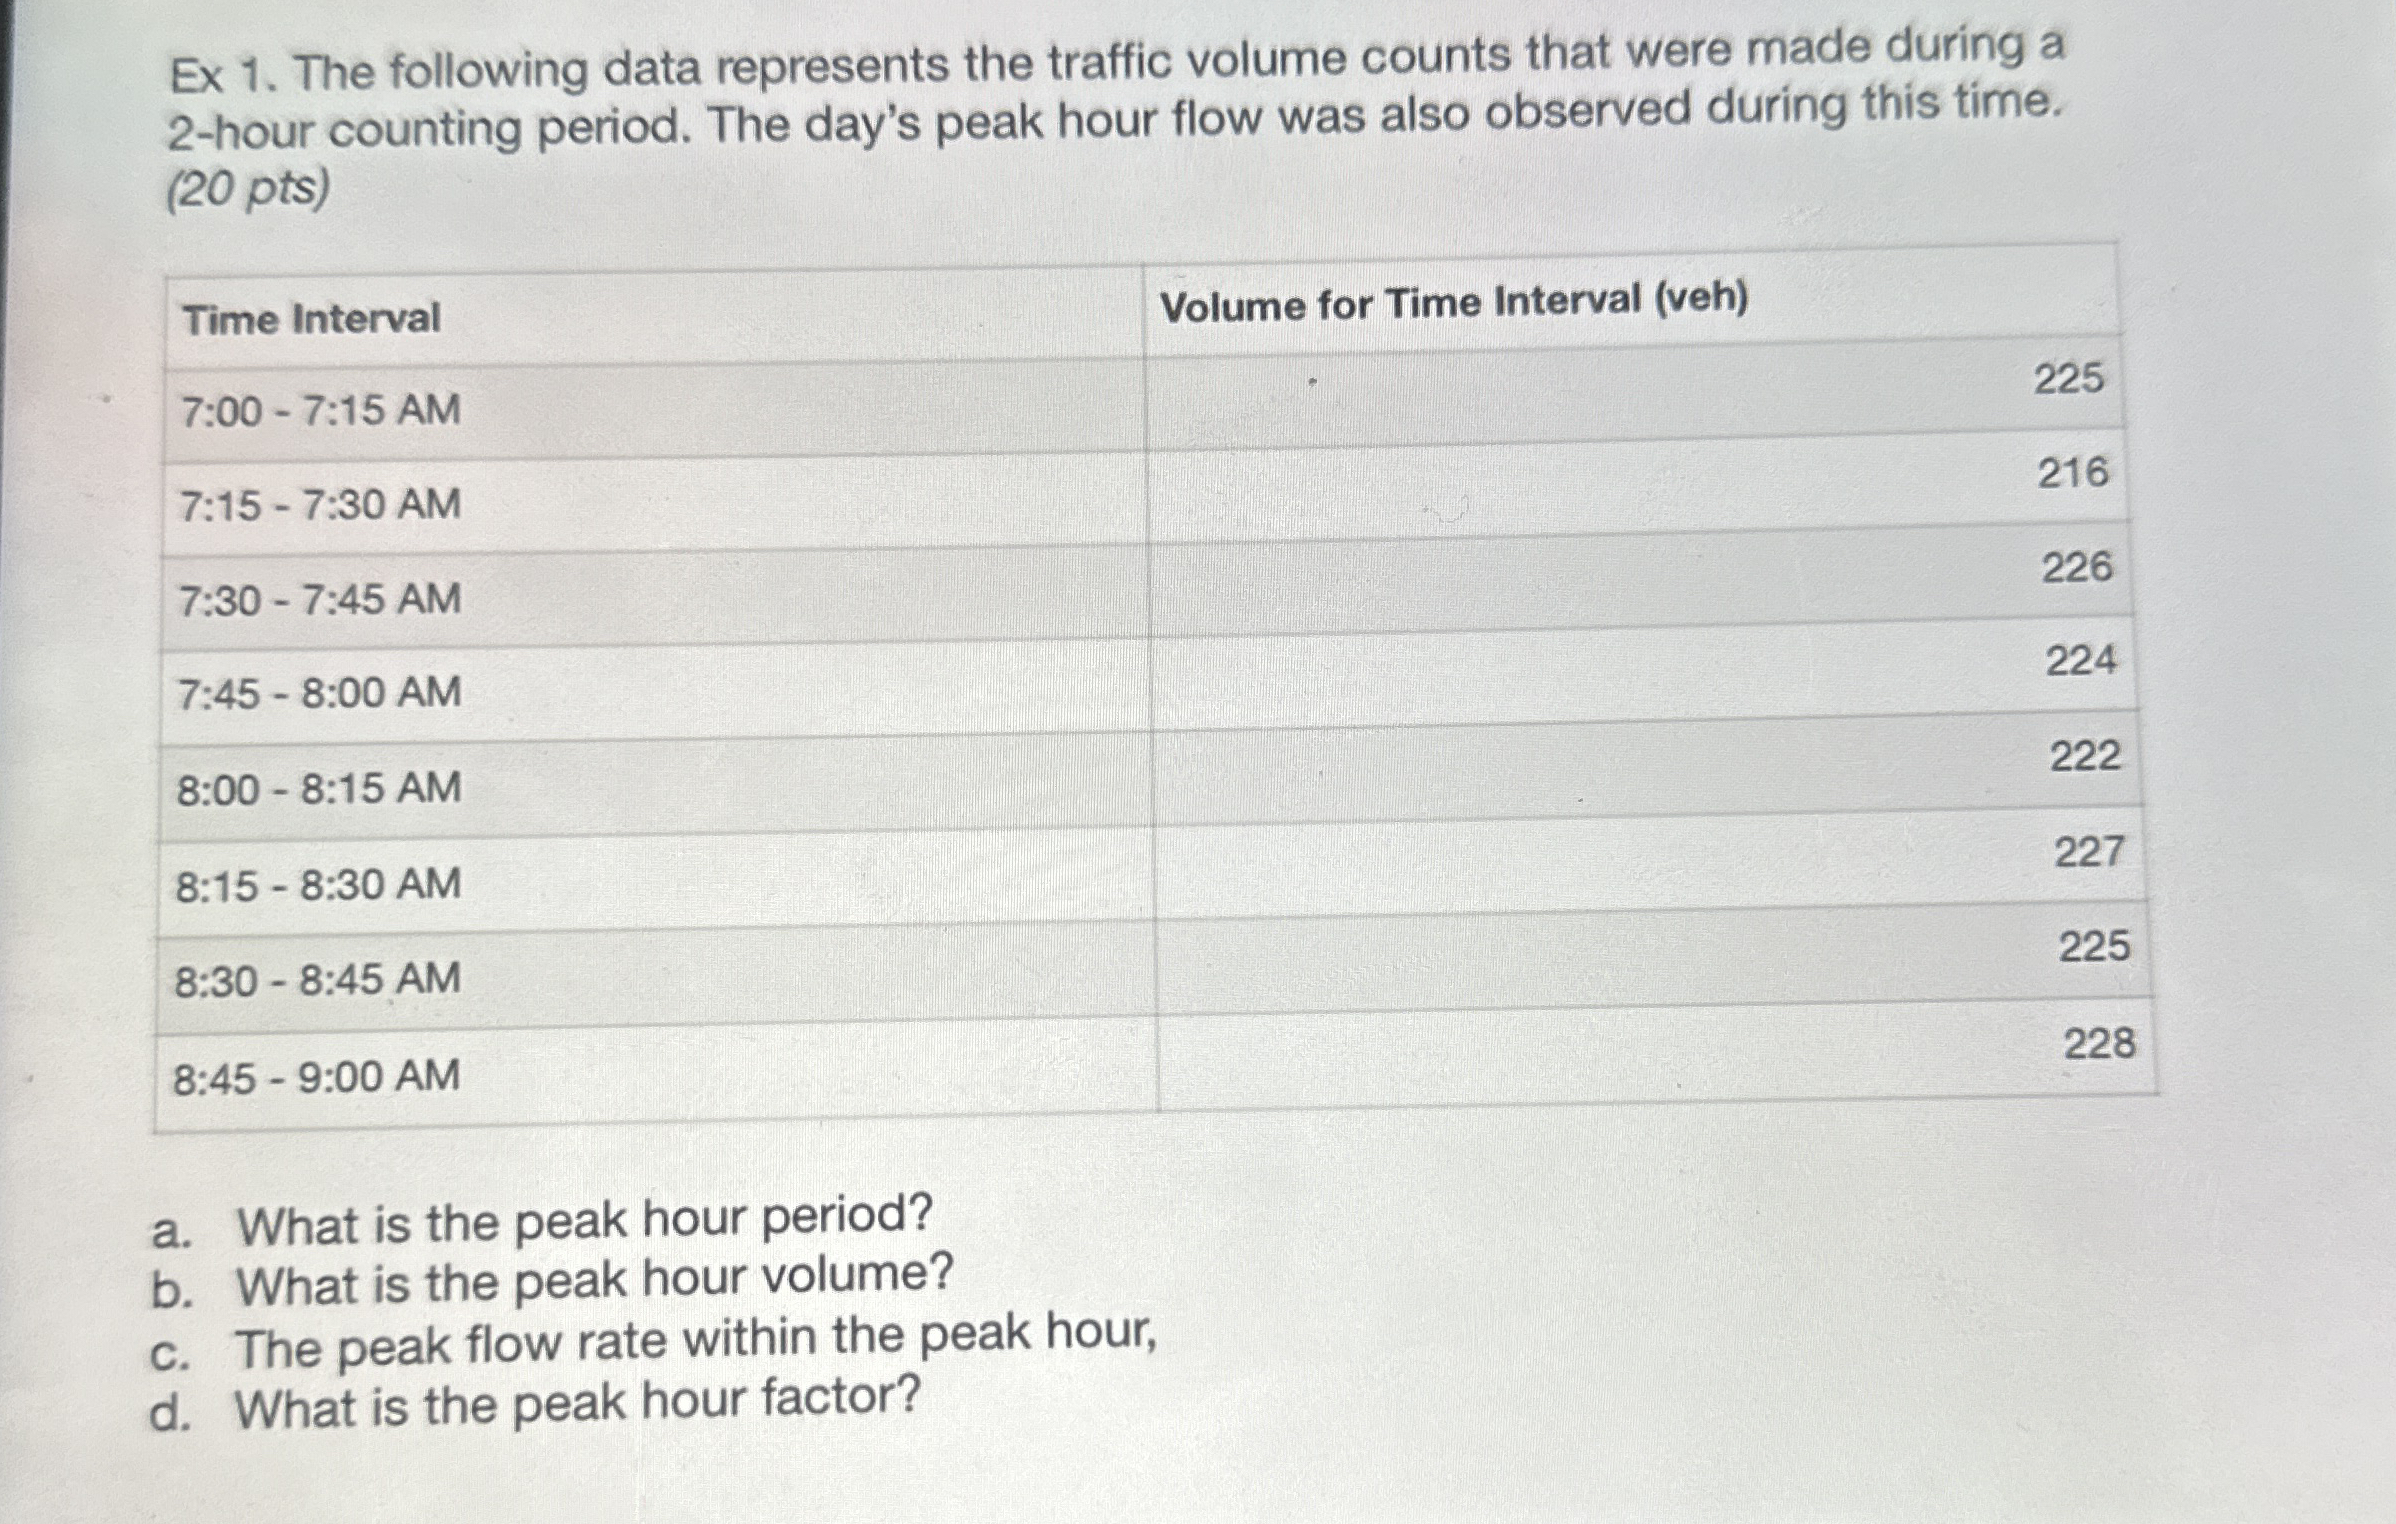
Ex The following data represents the traffic volume counts that were made during a hour counting period. The day's peak hour flow was also observed during this time. pts
tableTime Interval,Volume for Time Interval veh:: AM:: AM:: AM:: AM:: AM:: AM:: AM:: AM
a What is the peak hour period?
b What is the peak hour volume?
c The peak flow rate within the peak hour,
d What is the peak hour factor?
Step by Step Solution
There are 3 Steps involved in it
1 Expert Approved Answer
Step: 1 Unlock

Question Has Been Solved by an Expert!
Get step-by-step solutions from verified subject matter experts
Step: 2 Unlock
Step: 3 Unlock