

Question: Ex 4 - 5 : Mesh and plot a surface My Solutions > Write a function named ex 4 p 5 . It received two
Ex: Mesh and plot a surface
My Solutions
Write a function named exp It received two vector variables and returns three matrices.
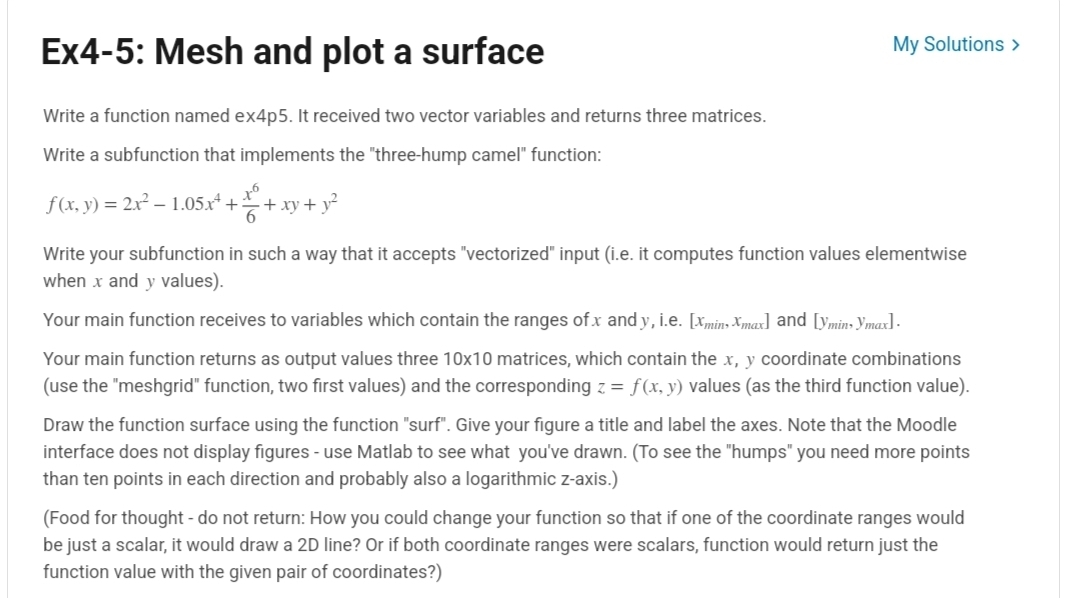
Write a subfunction that implements the "threehump camel" function:
Write your subfunction in such a way that it accepts "vectorized" input ie it computes function values elementwise when and values
Your main function receives to variables which contain the ranges of and ie and
Your main function returns as output values three matrices, which contain the coordinate combinations use the "meshgrid" function, two first values and the corresponding values as the third function value
Draw the function surface using the function "surf". Give your figure a title and label the axes. Note that the Moodle interface does not display figures use Matlab to see what you've drawn. To see the "humps" you need more points than ten points in each direction and probably also a logarithmic zaxis.
Food for thought do not return: How you could change your function so that if one of the coordinate ranges would be just a scalar, it would draw a D line? Or if both coordinate ranges were scalars, function would return just the function value with the given pair of coordinates?
Step by Step Solution
There are 3 Steps involved in it
1 Expert Approved Answer
Step: 1 Unlock

Question Has Been Solved by an Expert!
Get step-by-step solutions from verified subject matter experts
Step: 2 Unlock
Step: 3 Unlock