

Question: exact calcutions i need help with calculation in the green excel page what information do i need to show, i believe i posted the whole?
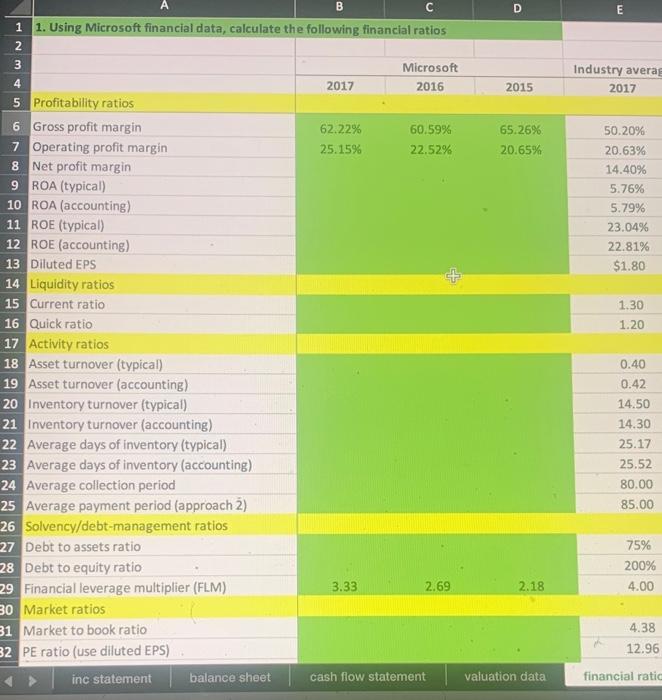
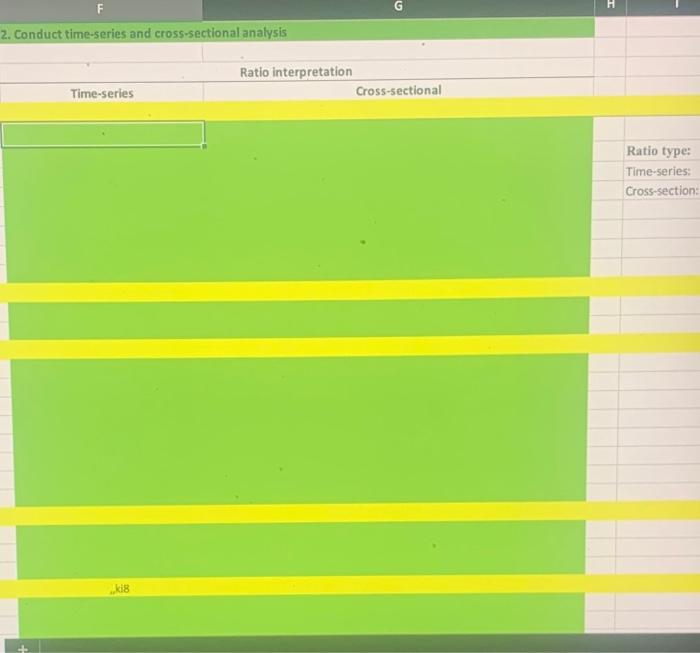
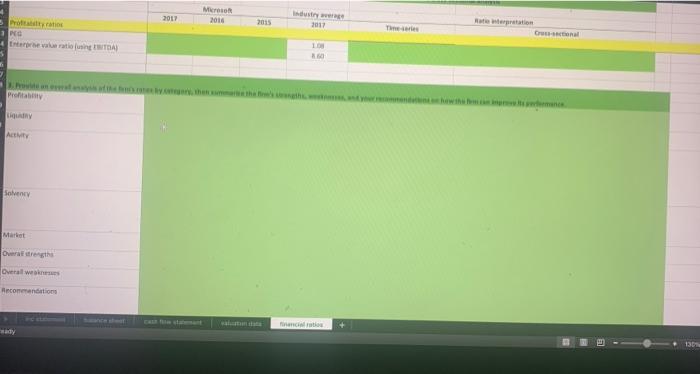
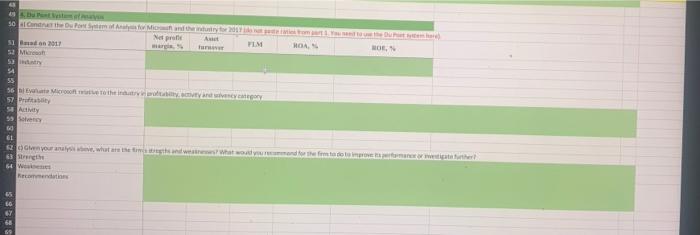
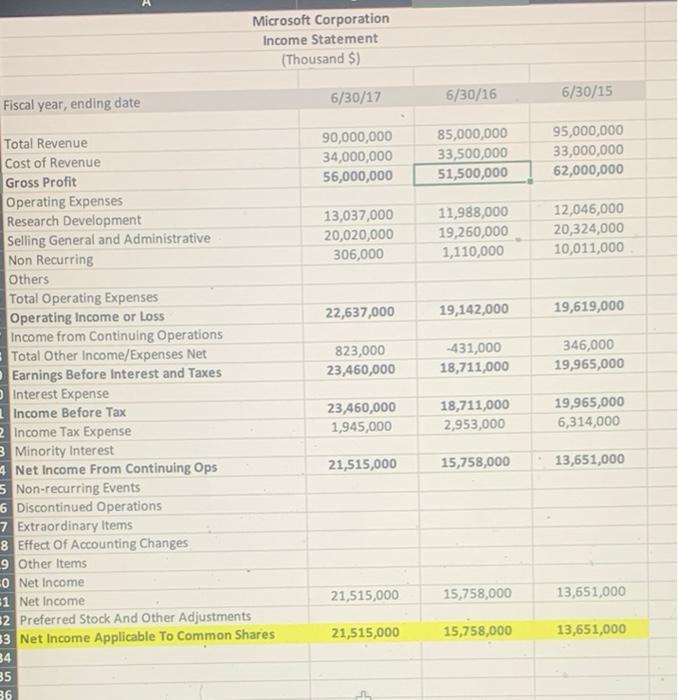
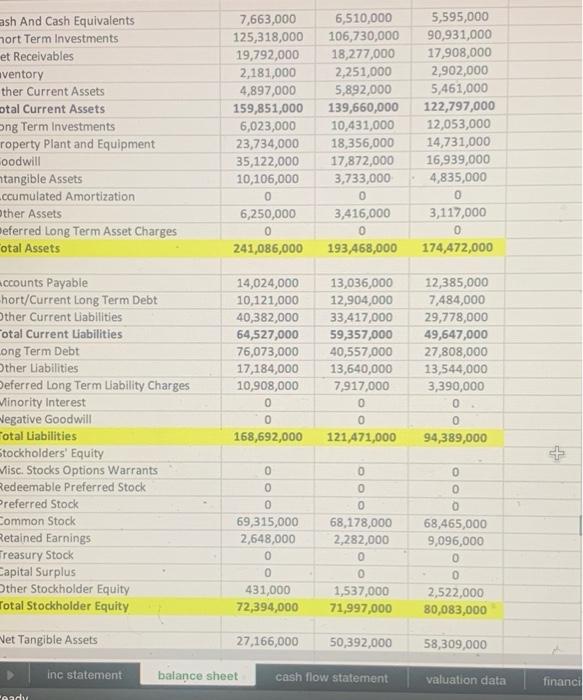
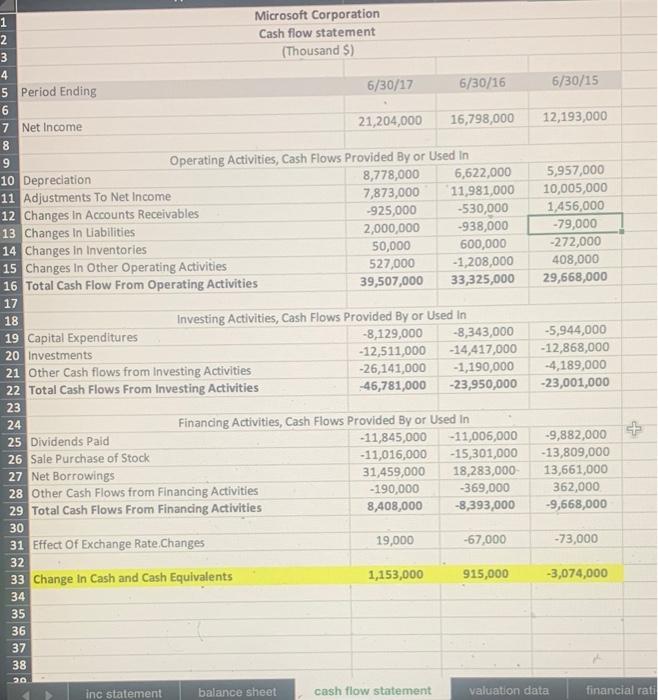
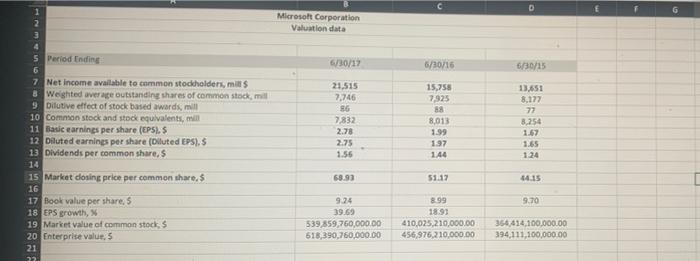
B E Industry averag 2017 50.20% 20.63% 14.40% 5.76% 5.79% 23.04% 22.81% $1.80 + 1.30 1.20 A D 1 1. Using Microsoft financial data, calculate the following financial ratios 2 3 Microsoft 4 2017 2016 2015 5 Profitability ratios 6 Gross profit margin 62.22% 60.59% 65.26% 7 Operating profit margin 25.15% 22.52% 20.65% 8 Net profit margin 9 ROA (typical) 10 ROA (accounting) 11 ROE (typical) 12 ROE (accounting) 13 Diluted EPS 14 Liquidity ratios 15 Current ratio 16 Quick ratio 17 Activity ratios 18 Asset turnover (typical) 19 Asset turnover (accounting) 20 Inventory turnover (typical) 21 Inventory turnover (accounting) 22 Average days of inventory (typical) 23 Average days of inventory (accounting) 24 Average collection period 25 Average payment period (approach 2) 26 Solvency/debt-management ratios 27 Debt to assets ratio 28 Debt to equity ratio 29 Financial leverage multiplier (FLM) 3.33 2.69 2.18 30 Market ratios 31 Market to book ratio 32 PE ratio (use diluted EPS) inc statement balance sheet cash flow statement valuation data 0.40 0.42 14.50 14.30 25.17 25.52 80.00 85.00 75% 200% 4.00 4.38 12.96 financial ratic G H 2. Conduct time-series and cross-sectional analysis Ratio interpretation Cross-sectional Time-series Ratio type: Time-series: Cross-section: kis 2017 Miro 2016 2015 st 2017 Thes Prati NO te vertoning Retrato C- 10 Ather Mart Recommendations 136 HOA , MOE, 50 Gandu Pont Monitor Ne prene AN PIM SI Badan 2011 5 Merah 53 54 55 36 te Micro than 57 Pry AM 99 Stery 61 you are what are mand wat woorde water 63 16 W Recommendations S96.5 A Microsoft Corporation Income Statement (Thousand $) 6/30/17 6/30/16 6/30/15 Fiscal year, ending date 90,000,000 34,000,000 56,000,000 85,000,000 33,500,000 51,500,000 95,000,000 33,000,000 62,000,000 13,037,000 20,020,000 306,000 11,988,000 19,260,000 1,110,000 12,046,000 20,324,000 10,011,000 22,637,000 19,142,000 19,619,000 823,000 23,460,000 -431,000 18,711,000 346,000 19,965,000 Total Revenue Cost of Revenue Gross Profit Operating Expenses Research Development Selling General and Administrative Non Recurring Others Total Operating Expenses Operating Income or Loss Income from Continuing Operations Total Other Income/Expenses Net Earnings Before Interest and Taxes Interest Expense Income Before Tax 2 Income Tax Expense 3 Minority Interest 4 Net Income From Continuing Ops 3 Non-recurring Events 16 Discontinued Operations 7 Extraordinary Items 8 Effect Of Accounting Changes 9 Other Items -0 Net Income 1 Net Income 32 Preferred Stock And Other Adjustments 33 Net Income Applicable To Common Shares 34 35 36 23,460,000 1,945,000 18,711,000 2,953,000 19,965,000 6,314,000 21,515,000 15,758,000 13,651,000 21,515,000 15,758,000 13,651,000 21,515,000 15,758,000 13,651,000 ash And Cash Equivalents hort Term Investments et Receivables ventory ther Current Assets otal Current Assets ang Term Investments roperty Plant and Equipment oodwill ntangible Assets ccumulated Amortization ther Assets eferred Long Term Asset Charges otal Assets 7,663,000 125,318,000 19,792,000 2,181,000 4,897,000 159,851,000 6,023,000 23,734,000 35,122,000 10,106,000 0 6,250,000 0 241,086,000 6,510,000 106,730,000 18,277,000 2,251,000 5,892,000 139,660,000 10,431,000 18,356,000 17,872,000 3,733,000 0 3,416,000 0 193,468,000 5,595,000 90,931,000 17,908,000 2,902,000 5,461,000 122,797,000 12,053,000 14,731,000 16,939,000 4,835,000 0 3,117,000 0 174,472,000 accounts Payable hort/Current Long Term Debt Other Current Liabilities otal Current liabilities Long Term Debt Other Liabilities Deferred Long Term Liability Charges Minority Interest Wegative Goodwill otal Liabilities Stockholders' Equity Misc. Stocks Options Warrants Redeemable Preferred Stock Preferred Stock Common Stock Retained Earnings Treasury Stock Capital Surplus ther Stockholder Equity Total Stockholder Equity 14,024,000 10,121,000 40,382,000 64,527,000 76,073,000 17,184,000 10,908,000 0 0 168,692,000 13,036,000 12,904,000 33,417,000 59,357,000 40,557,000 13,640,000 7,917,000 0 0 121,471,000 12,385,000 7,484,000 29,778,000 49,647,000 27,808,000 13,544,000 3,390,000 0 0 94,389,000 + 0 0 0 69,315,000 2,648,000 0 0 431,000 72,394,000 0 0 0 68,178,000 2,282,000 0 0 1,537,000 71,997,000 0 0 O 68,465,000 9,096,000 0 0 2,522,000 80,083,000 Net Tangible Assets 27,166,000 50,392,000 58,309,000 inc statement balance sheet cash flow statement valuation data financi cade 6/30/15 12,193,000 5,957,000 10,005,000 1,456,000 -79,000 -272,000 408,000 29,668,000 1 Microsoft Corporation 2 Cash flow statement 3 (Thousand S) 4 5 Period Ending 6/30/17 6/30/16 6 7 Net Income 21,204,000 16,798,000 8 9 Operating Activities, Cash Flows Provided By or Used In 10 Depreciation 8,778,000 6,622,000 11 Adjustments To Net Income 7,873,000 11,981,000 12 Changes in Accounts Receivables -925,000 -530,000 13 Changes in Liabilities 2,000,000 -938,000 14 Changes in Inventories 50,000 600,000 15 Changes in Other Operating Activities 527,000 -1,208,000 16 Total Cash Flow From Operating Activities 39,507,000 33,325,000 17 18 Investing Activities, Cash Flows Provided By or Used in 19 Capital Expenditures -8,129,000 -8,343,000 20 Investments -12,511,000 -14,417,000 21 Other Cash flows from investing Activities -26,141,000 -1,190,000 22 Total Cash Flows From Investing Activities -46,781,000 -23,950,000 23 24 Financing Activities, Cash Flows Provided By or Used In 25 Dividends Paid -11,845,000 -11,006,000 26 Sale Purchase of Stock -11,016,000 -15,301,000 27 Net Borrowings 31,459,000 18,283,000 28 Other Cash Flows from Financing Activities -190,000 -369,000 29 Total Cash Flows From Financing Activities 8,408,000 -8,393,000 30 31 Effect Of Exchange Rate Changes 19,000 -67,000 32 33 Change in Cash and Cash Equivalents 1,153,000 915,000 -5,944,000 -12,868,000 -4,189,000 -23,001,000 -9,882,000 - 13,809,000 13,661,000 362,000 -9,668,000 -73,000 -3,074,000 34 35 36 37 38 20 inc statement balance sheet cash flow statement valuation data financial rati D Microsoft Corporation Valuation data 6/30/17 6/30/16 6/30/15 15,758 7.925 1 2 3 4 5 Period Ending 6 7 Net Income available to common stockholders, mis 8 Weighted average outstanding shares of common stock, mil 9 Dilutive effect of stock based awards, il 10 Common stock and stock equivalents, mil 11 Basic earnings per share (EPSI. 5 12 Diluted earnings per share (Olluted EPS). S 13 Dividends per common share. S 14 15 Market closing price per common shares 16 17 Book value per shares 18 EPS growth, 19 Market value of common stock, $ 20 Enterprise value. 5 21 22 21,515 7,746 86 7,832 2.78 2.75 1.56 13,651 8.177 77 8.254 8.013 1.99 197 144 1.65 1.24 68.91 51.17 44.15 9.70 9.24 39.69 539,559,760,000.00 618,390,760,000.00 8.99 1891 410,025,210,000.00 456,976,210,000.00 354,614,100,000.00 394,111,100,000.00 Ch 3 Case: Microsoft Financial Ratios Analysis Using the provided Excel template and Microsoft's financial statements, 1. Calculate the Microsoft financial ratios shown in the provided template. Make sure to show your work/build-in formulas in Excel. 2. Provide a time-series and a cross-sectional analysis of Microsoft's ratios using the performance descriptor labels provided in Excel. 3. Provide an overall analysis of the firm's financial ratios by category, then summarize its strengths, weakness, and your recommendations on how the firm can improve its performance 4. Construct the Du Pont System of Analysis for Microsoft (a) calculate the ROE for Microsoft and the industry for 2017 using the Du Pont approach (b) evaluate Microsoft relative to the industry in profitability, activity and solvency categories of ratios (c) using the Du Pont results, explain the firm's strengths and weaknesses and provide your recommendations as to what the firm should do to improve its performance, or what areas it should investigate further. B E Industry averag 2017 50.20% 20.63% 14.40% 5.76% 5.79% 23.04% 22.81% $1.80 + 1.30 1.20 A D 1 1. Using Microsoft financial data, calculate the following financial ratios 2 3 Microsoft 4 2017 2016 2015 5 Profitability ratios 6 Gross profit margin 62.22% 60.59% 65.26% 7 Operating profit margin 25.15% 22.52% 20.65% 8 Net profit margin 9 ROA (typical) 10 ROA (accounting) 11 ROE (typical) 12 ROE (accounting) 13 Diluted EPS 14 Liquidity ratios 15 Current ratio 16 Quick ratio 17 Activity ratios 18 Asset turnover (typical) 19 Asset turnover (accounting) 20 Inventory turnover (typical) 21 Inventory turnover (accounting) 22 Average days of inventory (typical) 23 Average days of inventory (accounting) 24 Average collection period 25 Average payment period (approach 2) 26 Solvency/debt-management ratios 27 Debt to assets ratio 28 Debt to equity ratio 29 Financial leverage multiplier (FLM) 3.33 2.69 2.18 30 Market ratios 31 Market to book ratio 32 PE ratio (use diluted EPS) inc statement balance sheet cash flow statement valuation data 0.40 0.42 14.50 14.30 25.17 25.52 80.00 85.00 75% 200% 4.00 4.38 12.96 financial ratic G H 2. Conduct time-series and cross-sectional analysis Ratio interpretation Cross-sectional Time-series Ratio type: Time-series: Cross-section: kis 2017 Miro 2016 2015 st 2017 Thes Prati NO te vertoning Retrato C- 10 Ather Mart Recommendations 136 HOA , MOE, 50 Gandu Pont Monitor Ne prene AN PIM SI Badan 2011 5 Merah 53 54 55 36 te Micro than 57 Pry AM 99 Stery 61 you are what are mand wat woorde water 63 16 W Recommendations S96.5 A Microsoft Corporation Income Statement (Thousand $) 6/30/17 6/30/16 6/30/15 Fiscal year, ending date 90,000,000 34,000,000 56,000,000 85,000,000 33,500,000 51,500,000 95,000,000 33,000,000 62,000,000 13,037,000 20,020,000 306,000 11,988,000 19,260,000 1,110,000 12,046,000 20,324,000 10,011,000 22,637,000 19,142,000 19,619,000 823,000 23,460,000 -431,000 18,711,000 346,000 19,965,000 Total Revenue Cost of Revenue Gross Profit Operating Expenses Research Development Selling General and Administrative Non Recurring Others Total Operating Expenses Operating Income or Loss Income from Continuing Operations Total Other Income/Expenses Net Earnings Before Interest and Taxes Interest Expense Income Before Tax 2 Income Tax Expense 3 Minority Interest 4 Net Income From Continuing Ops 3 Non-recurring Events 16 Discontinued Operations 7 Extraordinary Items 8 Effect Of Accounting Changes 9 Other Items -0 Net Income 1 Net Income 32 Preferred Stock And Other Adjustments 33 Net Income Applicable To Common Shares 34 35 36 23,460,000 1,945,000 18,711,000 2,953,000 19,965,000 6,314,000 21,515,000 15,758,000 13,651,000 21,515,000 15,758,000 13,651,000 21,515,000 15,758,000 13,651,000 ash And Cash Equivalents hort Term Investments et Receivables ventory ther Current Assets otal Current Assets ang Term Investments roperty Plant and Equipment oodwill ntangible Assets ccumulated Amortization ther Assets eferred Long Term Asset Charges otal Assets 7,663,000 125,318,000 19,792,000 2,181,000 4,897,000 159,851,000 6,023,000 23,734,000 35,122,000 10,106,000 0 6,250,000 0 241,086,000 6,510,000 106,730,000 18,277,000 2,251,000 5,892,000 139,660,000 10,431,000 18,356,000 17,872,000 3,733,000 0 3,416,000 0 193,468,000 5,595,000 90,931,000 17,908,000 2,902,000 5,461,000 122,797,000 12,053,000 14,731,000 16,939,000 4,835,000 0 3,117,000 0 174,472,000 accounts Payable hort/Current Long Term Debt Other Current Liabilities otal Current liabilities Long Term Debt Other Liabilities Deferred Long Term Liability Charges Minority Interest Wegative Goodwill otal Liabilities Stockholders' Equity Misc. Stocks Options Warrants Redeemable Preferred Stock Preferred Stock Common Stock Retained Earnings Treasury Stock Capital Surplus ther Stockholder Equity Total Stockholder Equity 14,024,000 10,121,000 40,382,000 64,527,000 76,073,000 17,184,000 10,908,000 0 0 168,692,000 13,036,000 12,904,000 33,417,000 59,357,000 40,557,000 13,640,000 7,917,000 0 0 121,471,000 12,385,000 7,484,000 29,778,000 49,647,000 27,808,000 13,544,000 3,390,000 0 0 94,389,000 + 0 0 0 69,315,000 2,648,000 0 0 431,000 72,394,000 0 0 0 68,178,000 2,282,000 0 0 1,537,000 71,997,000 0 0 O 68,465,000 9,096,000 0 0 2,522,000 80,083,000 Net Tangible Assets 27,166,000 50,392,000 58,309,000 inc statement balance sheet cash flow statement valuation data financi cade 6/30/15 12,193,000 5,957,000 10,005,000 1,456,000 -79,000 -272,000 408,000 29,668,000 1 Microsoft Corporation 2 Cash flow statement 3 (Thousand S) 4 5 Period Ending 6/30/17 6/30/16 6 7 Net Income 21,204,000 16,798,000 8 9 Operating Activities, Cash Flows Provided By or Used In 10 Depreciation 8,778,000 6,622,000 11 Adjustments To Net Income 7,873,000 11,981,000 12 Changes in Accounts Receivables -925,000 -530,000 13 Changes in Liabilities 2,000,000 -938,000 14 Changes in Inventories 50,000 600,000 15 Changes in Other Operating Activities 527,000 -1,208,000 16 Total Cash Flow From Operating Activities 39,507,000 33,325,000 17 18 Investing Activities, Cash Flows Provided By or Used in 19 Capital Expenditures -8,129,000 -8,343,000 20 Investments -12,511,000 -14,417,000 21 Other Cash flows from investing Activities -26,141,000 -1,190,000 22 Total Cash Flows From Investing Activities -46,781,000 -23,950,000 23 24 Financing Activities, Cash Flows Provided By or Used In 25 Dividends Paid -11,845,000 -11,006,000 26 Sale Purchase of Stock -11,016,000 -15,301,000 27 Net Borrowings 31,459,000 18,283,000 28 Other Cash Flows from Financing Activities -190,000 -369,000 29 Total Cash Flows From Financing Activities 8,408,000 -8,393,000 30 31 Effect Of Exchange Rate Changes 19,000 -67,000 32 33 Change in Cash and Cash Equivalents 1,153,000 915,000 -5,944,000 -12,868,000 -4,189,000 -23,001,000 -9,882,000 - 13,809,000 13,661,000 362,000 -9,668,000 -73,000 -3,074,000 34 35 36 37 38 20 inc statement balance sheet cash flow statement valuation data financial rati D Microsoft Corporation Valuation data 6/30/17 6/30/16 6/30/15 15,758 7.925 1 2 3 4 5 Period Ending 6 7 Net Income available to common stockholders, mis 8 Weighted average outstanding shares of common stock, mil 9 Dilutive effect of stock based awards, il 10 Common stock and stock equivalents, mil 11 Basic earnings per share (EPSI. 5 12 Diluted earnings per share (Olluted EPS). S 13 Dividends per common share. S 14 15 Market closing price per common shares 16 17 Book value per shares 18 EPS growth, 19 Market value of common stock, $ 20 Enterprise value. 5 21 22 21,515 7,746 86 7,832 2.78 2.75 1.56 13,651 8.177 77 8.254 8.013 1.99 197 144 1.65 1.24 68.91 51.17 44.15 9.70 9.24 39.69 539,559,760,000.00 618,390,760,000.00 8.99 1891 410,025,210,000.00 456,976,210,000.00 354,614,100,000.00 394,111,100,000.00 Ch 3 Case: Microsoft Financial Ratios Analysis Using the provided Excel template and Microsoft's financial statements, 1. Calculate the Microsoft financial ratios shown in the provided template. Make sure to show your work/build-in formulas in Excel. 2. Provide a time-series and a cross-sectional analysis of Microsoft's ratios using the performance descriptor labels provided in Excel. 3. Provide an overall analysis of the firm's financial ratios by category, then summarize its strengths, weakness, and your recommendations on how the firm can improve its performance 4. Construct the Du Pont System of Analysis for Microsoft (a) calculate the ROE for Microsoft and the industry for 2017 using the Du Pont approach (b) evaluate Microsoft relative to the industry in profitability, activity and solvency categories of ratios (c) using the Du Pont results, explain the firm's strengths and weaknesses and provide your recommendations as to what the firm should do to improve its performance, or what areas it should investigate further
Step by Step Solution
There are 3 Steps involved in it

Get step-by-step solutions from verified subject matter experts