

Question: Examine the frequency distribution table and bar graph found below for how often people ( specifically boys and girls ) were seriously injured from fights
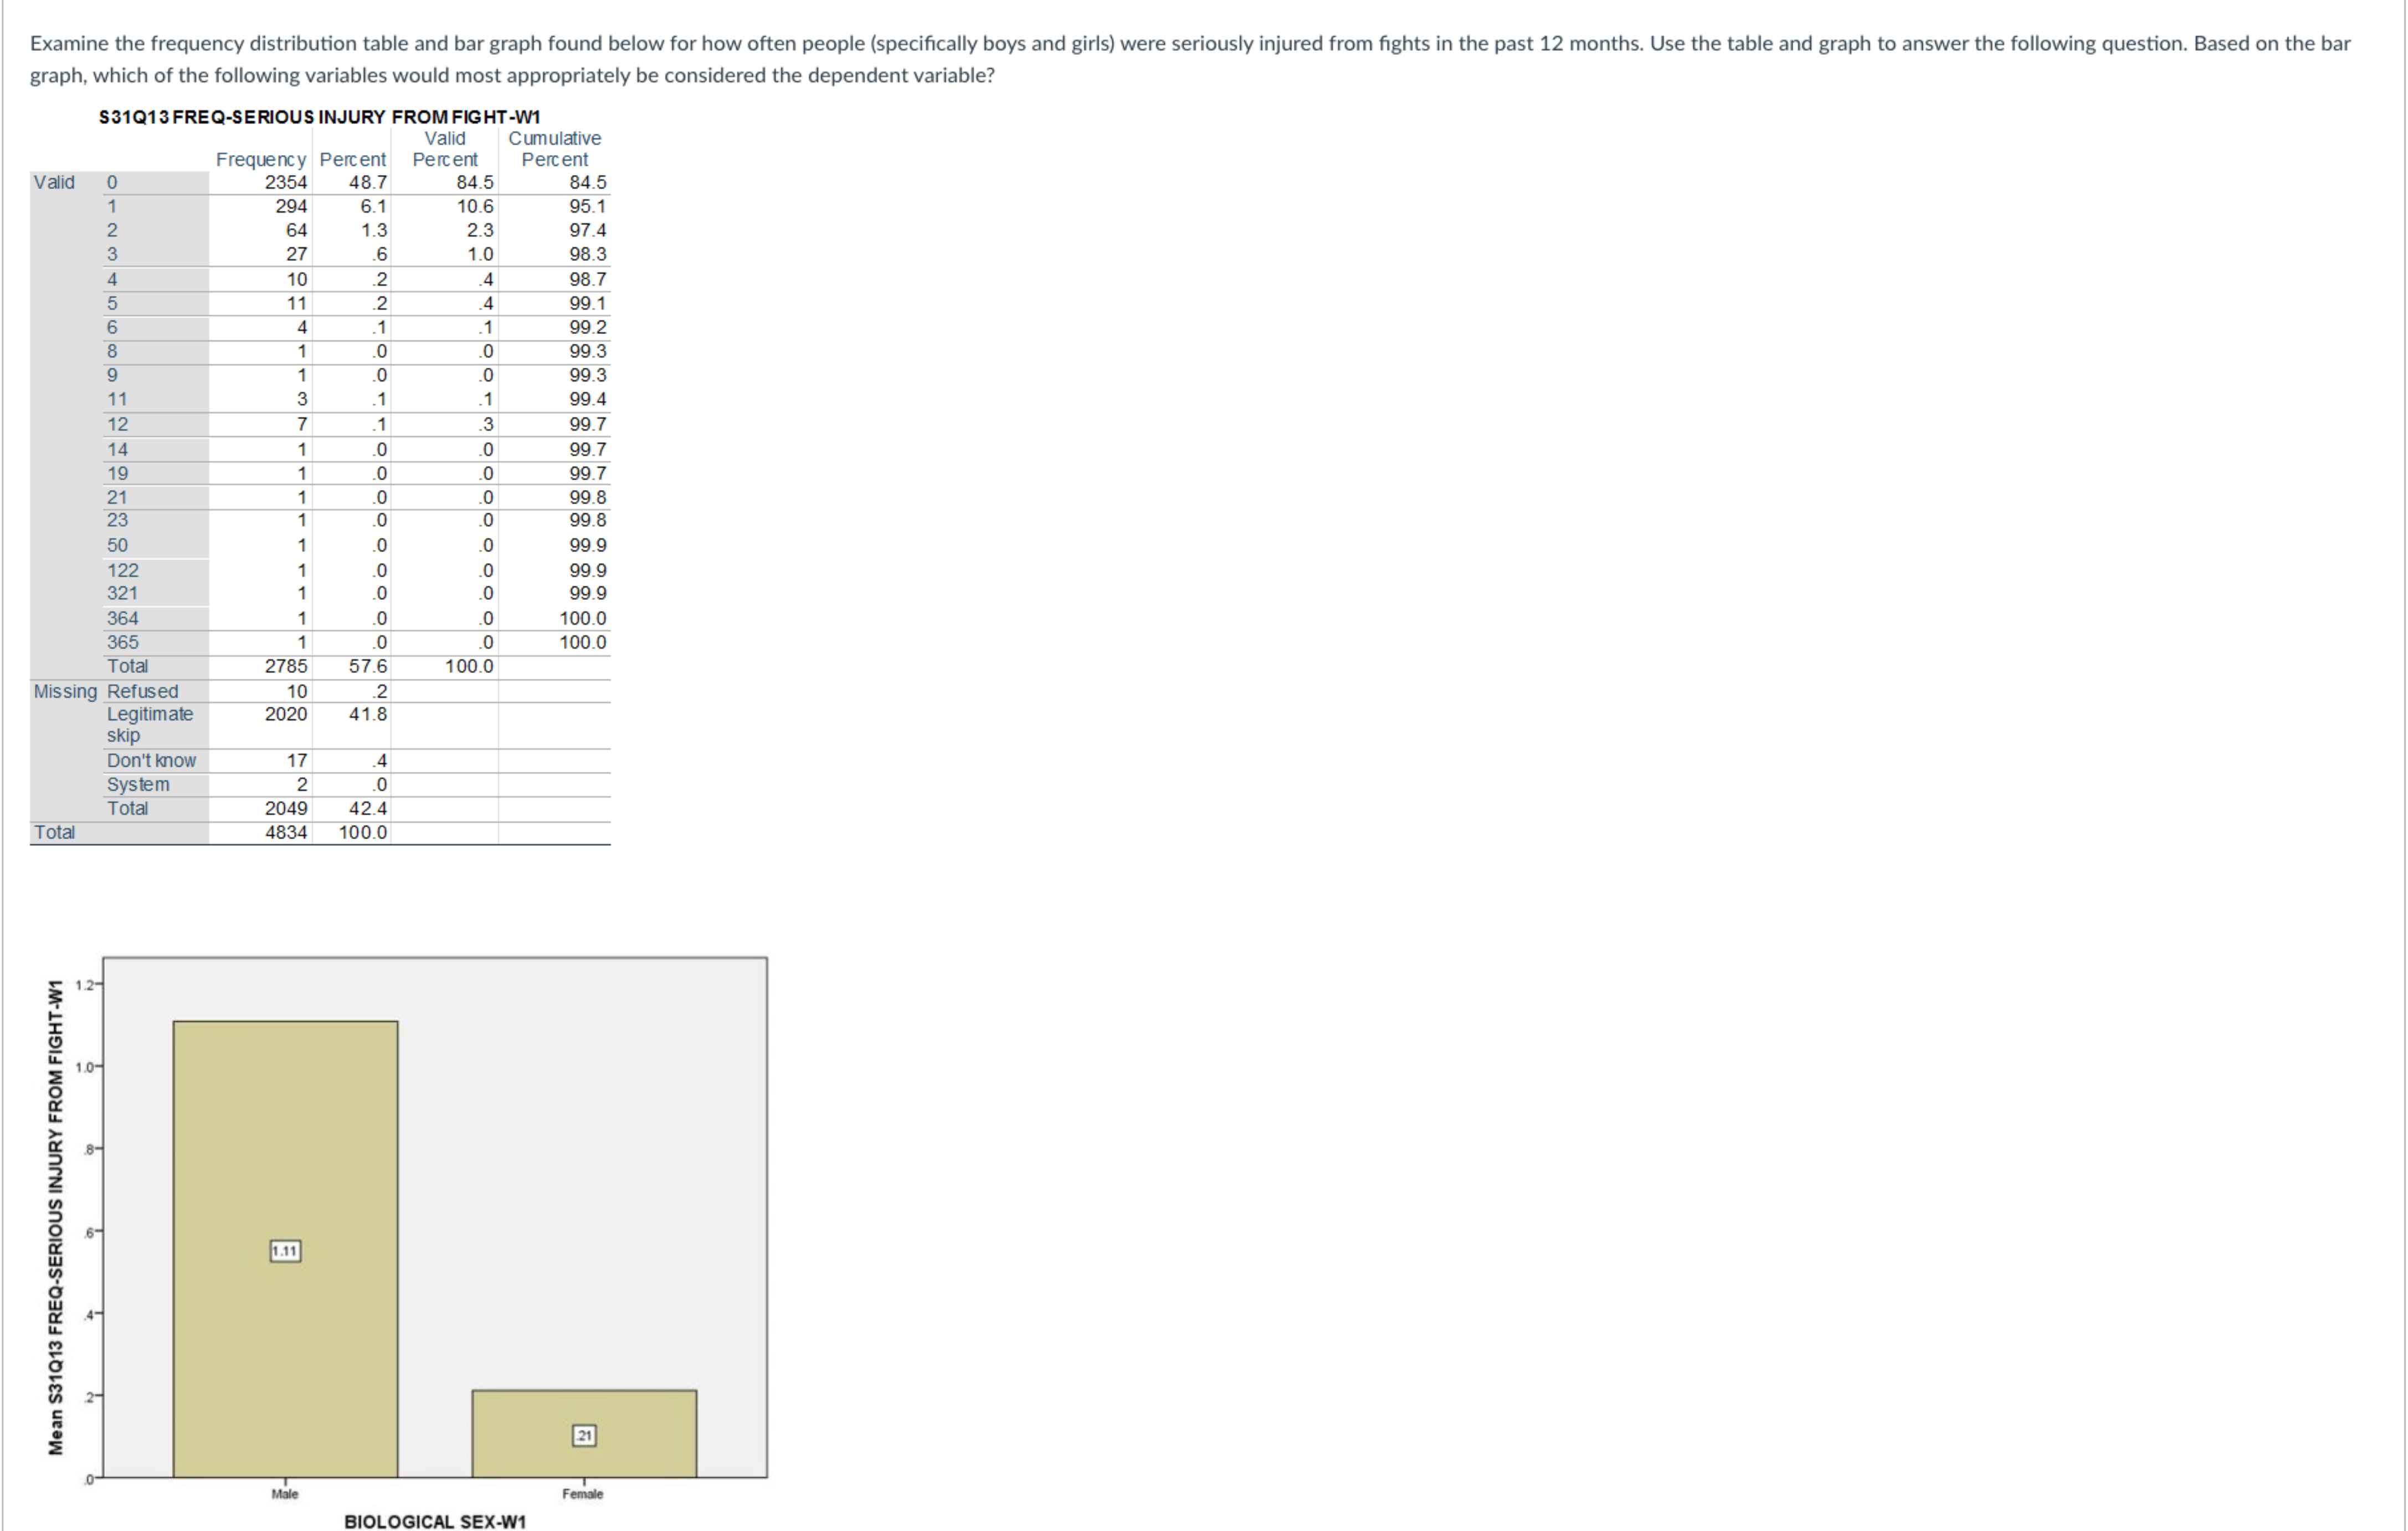
Examine the frequency distribution table and bar graph found below for how often people specifically boys and girls were seriously injured from fights in the past months. Use the table and graph to answer the following question. Based on the bar graph, which of the following variables would most appropriately be considered the dependent variable?graph, which of the following variables would most appropriately be considered the dependent variable?
SQ FREQSERIOUS INJURY FROM FIGHTW
Step by Step Solution
There are 3 Steps involved in it
1 Expert Approved Answer
Step: 1 Unlock

Question Has Been Solved by an Expert!
Get step-by-step solutions from verified subject matter experts
Step: 2 Unlock
Step: 3 Unlock