

Question: Examine the graph below and answer the questions that follow. Price of coffee R100 R80 R60 R40 R20 100 200 300 400 500 Quantity of
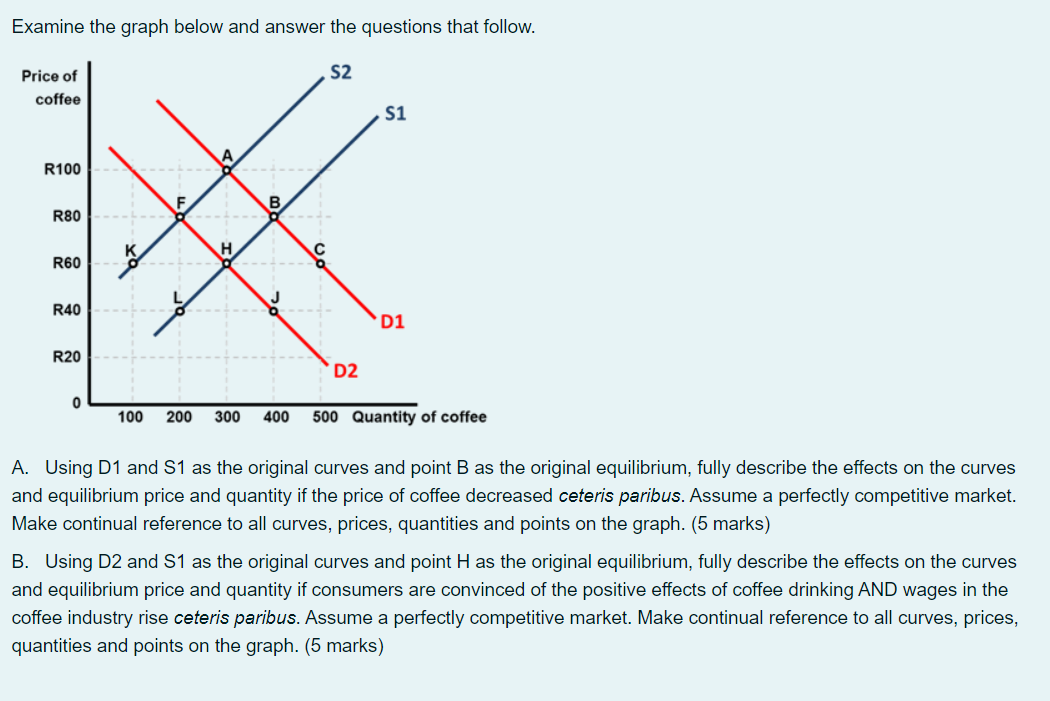
Examine the graph below and answer the questions that follow. Price of coffee R100 R80 R60 R40 R20 100 200 300 400 500 Quantity of coffee A. Using D1 and 31 as the original curves and point B as the original equilibrium, fully describe the effects on the curves and equilibrium price and quantity if the price of coffee decreased ceten's paribus. Assume a perfectly competitive market. Make continual reference to all curves, prices, quantities and points on the graph. (5 marks} B. Using D2 and 31 as the original curves and point H as the original equilibrium= fully describe the effects on the curves and equilibrium price and quantity if consumers are convinced of the positive effects of coffee drinking AND wages in the coffee industry rise ceferr's paribus. Assume a perfectly competitive market. Make continual reference to all curves, prices, quantities and points on the graph
Step by Step Solution
There are 3 Steps involved in it

Get step-by-step solutions from verified subject matter experts