

Question: Examine the graphics display and errors for the approximations.The sampled data is of a uniformly sampled line. Comment on the behavior of the approximation based
Examine the graphics display and errors for the approximations.The sampled data is of a uniformly sampled line.
Comment on the behavior of the approximation based on the degree and parameters. Anything interesting/special?
Share any general observations regarding the two parameter generation methods and the approximation degree.
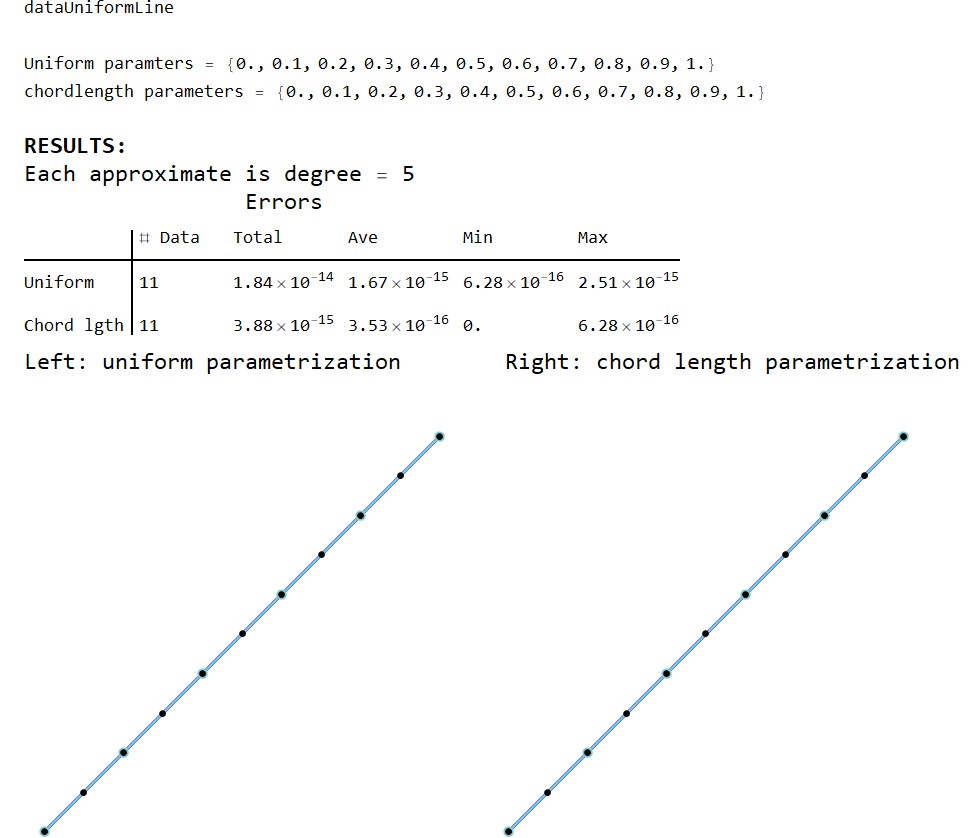
dataUniformLine Uniform paramters = {0. , 0.1, 0.2, 0.3, 0.4, 0.5, 0.6, 0.7, 0.8, 0.9, 1. } chordlength parameters = {0. , 0.1, 0.2, 0.3, 0.4, 0.5, 0.6, 0.7, 0.8, 0.9, 1. } RESULTS : Each approximate is degree = 5 Errors # Data Total Ave Min Max Uniform 11 1. 84 x 10 14 1. 67 x 10 15 6. 28 x 10 16 2.51 x 10⁻¹⁵ Chord 1gth 11 3. 88 x 10 15 3.53 x 10⁻¹⁶ 0. 6. 28 x 10-16 Left: uniform parametrization Right: chord length parametrization
Step by Step Solution
There are 3 Steps involved in it

Get step-by-step solutions from verified subject matter experts