

Question: Examine the normal quantile plot and determine whether it depicts sample data from a population with a normal distribution. Does the normal quantile plot
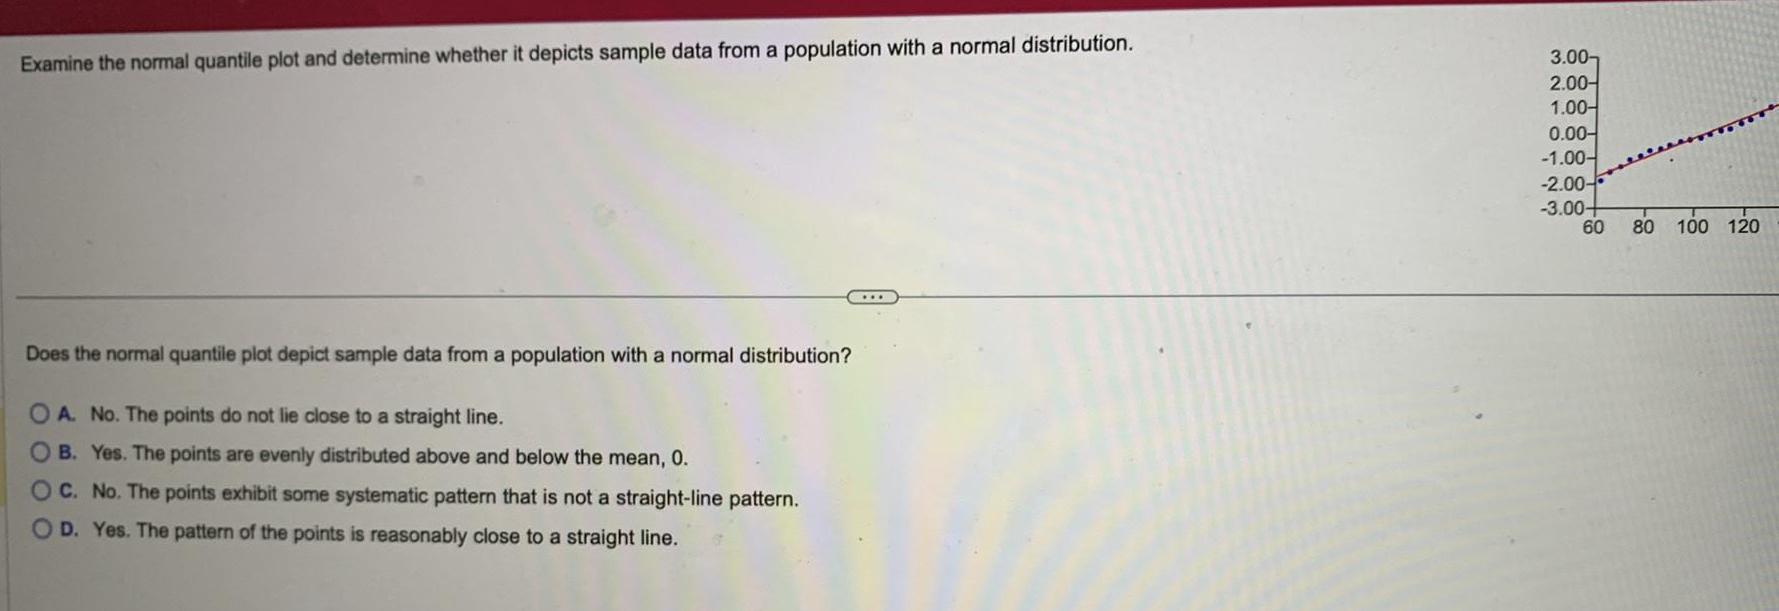
Examine the normal quantile plot and determine whether it depicts sample data from a population with a normal distribution. Does the normal quantile plot depict sample data from a population with a normal distribution? OA. No. The points do not lie close to a straight line. OB. Yes. The points are evenly distributed above and below the mean, 0. OC. No. The points exhibit some systematic pattern that is not a straight-line pattern. OD. Yes. The pattern of the points is reasonably close to a straight line. 3.00 2.00- 1.00- 0.00- -1.00- -2.00- -3.00+ +8 60 80 100 120
Step by Step Solution
There are 3 Steps involved in it

Get step-by-step solutions from verified subject matter experts