

Question: Examine the Statistical Process Control outputs below. Answer the following question. Mean Range UCL (Upper control limit) 12.6856 1.0193 CL (Center line) 12.36 0.67
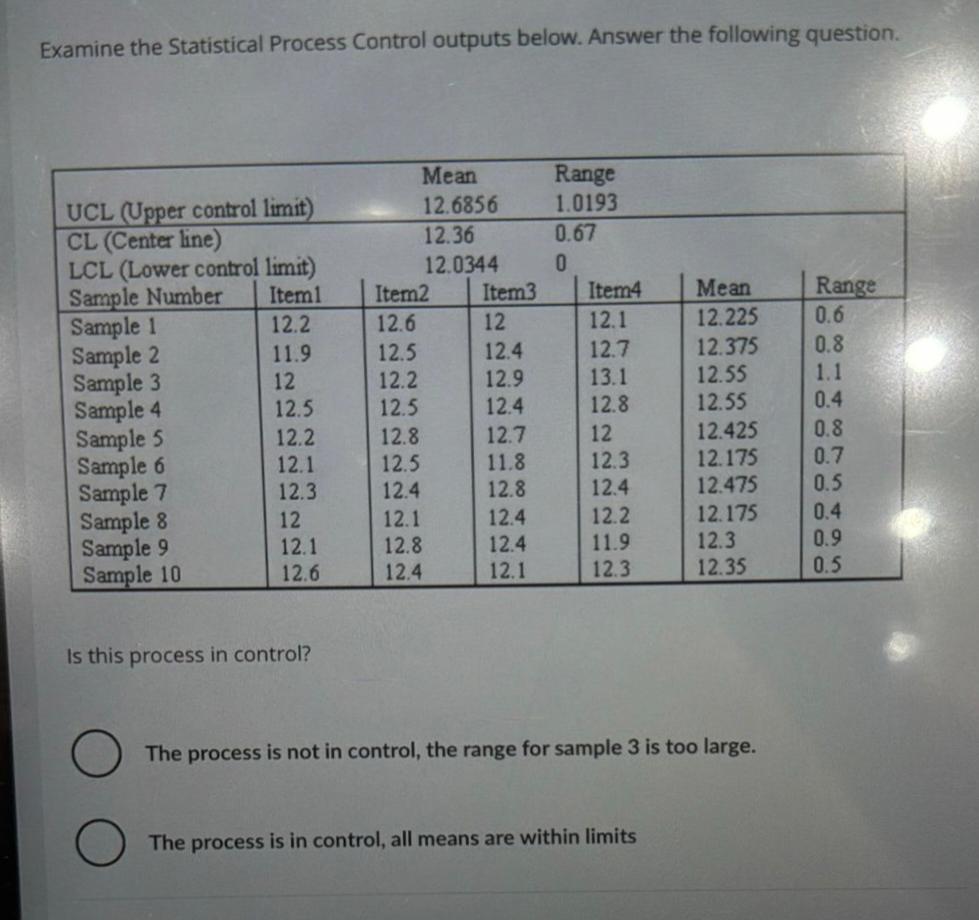
Examine the Statistical Process Control outputs below. Answer the following question. Mean Range UCL (Upper control limit) 12.6856 1.0193 CL (Center line) 12.36 0.67 LCL (Lower control limit) 12.0344 0 Sample Number Iteml Item2 Item3 Item4 Mean Range Sample 1 12.2 12.6 12 12.1 12.225 0.6 Sample 2 11.9 12.5 12.4 12.7 12.375 0.8 Sample 3 12 12.2 12.9 13.1 12.55 1.1 Sample 4 12.5 12.5 12.4 12.8 12.55 0.4 Sample 5 12.2 12.8 12.7 12 12.425 0.8 Sample 6 12.1 12.5 11.8 12.3 12.175 0.7 Sample 7 12.3 12.4 12.8 12.4 12.475 0.5 Sample 8 12 12.1 12.4 12.2 12.175 0.4 Sample 9 12.1 12.8 12.4 11.9 12.3 0.9 Sample 10 12.6 12.4 12.1 12.3 12.35 0.5 Is this process in control? The process is not in control, the range for sample 3 is too large. The process is in control, all means are within limits
Step by Step Solution
There are 3 Steps involved in it

Get step-by-step solutions from verified subject matter experts