

Question: Examine the table below and then answer the question that follows: The table below shows a number of economic indicators for three consecutive years in
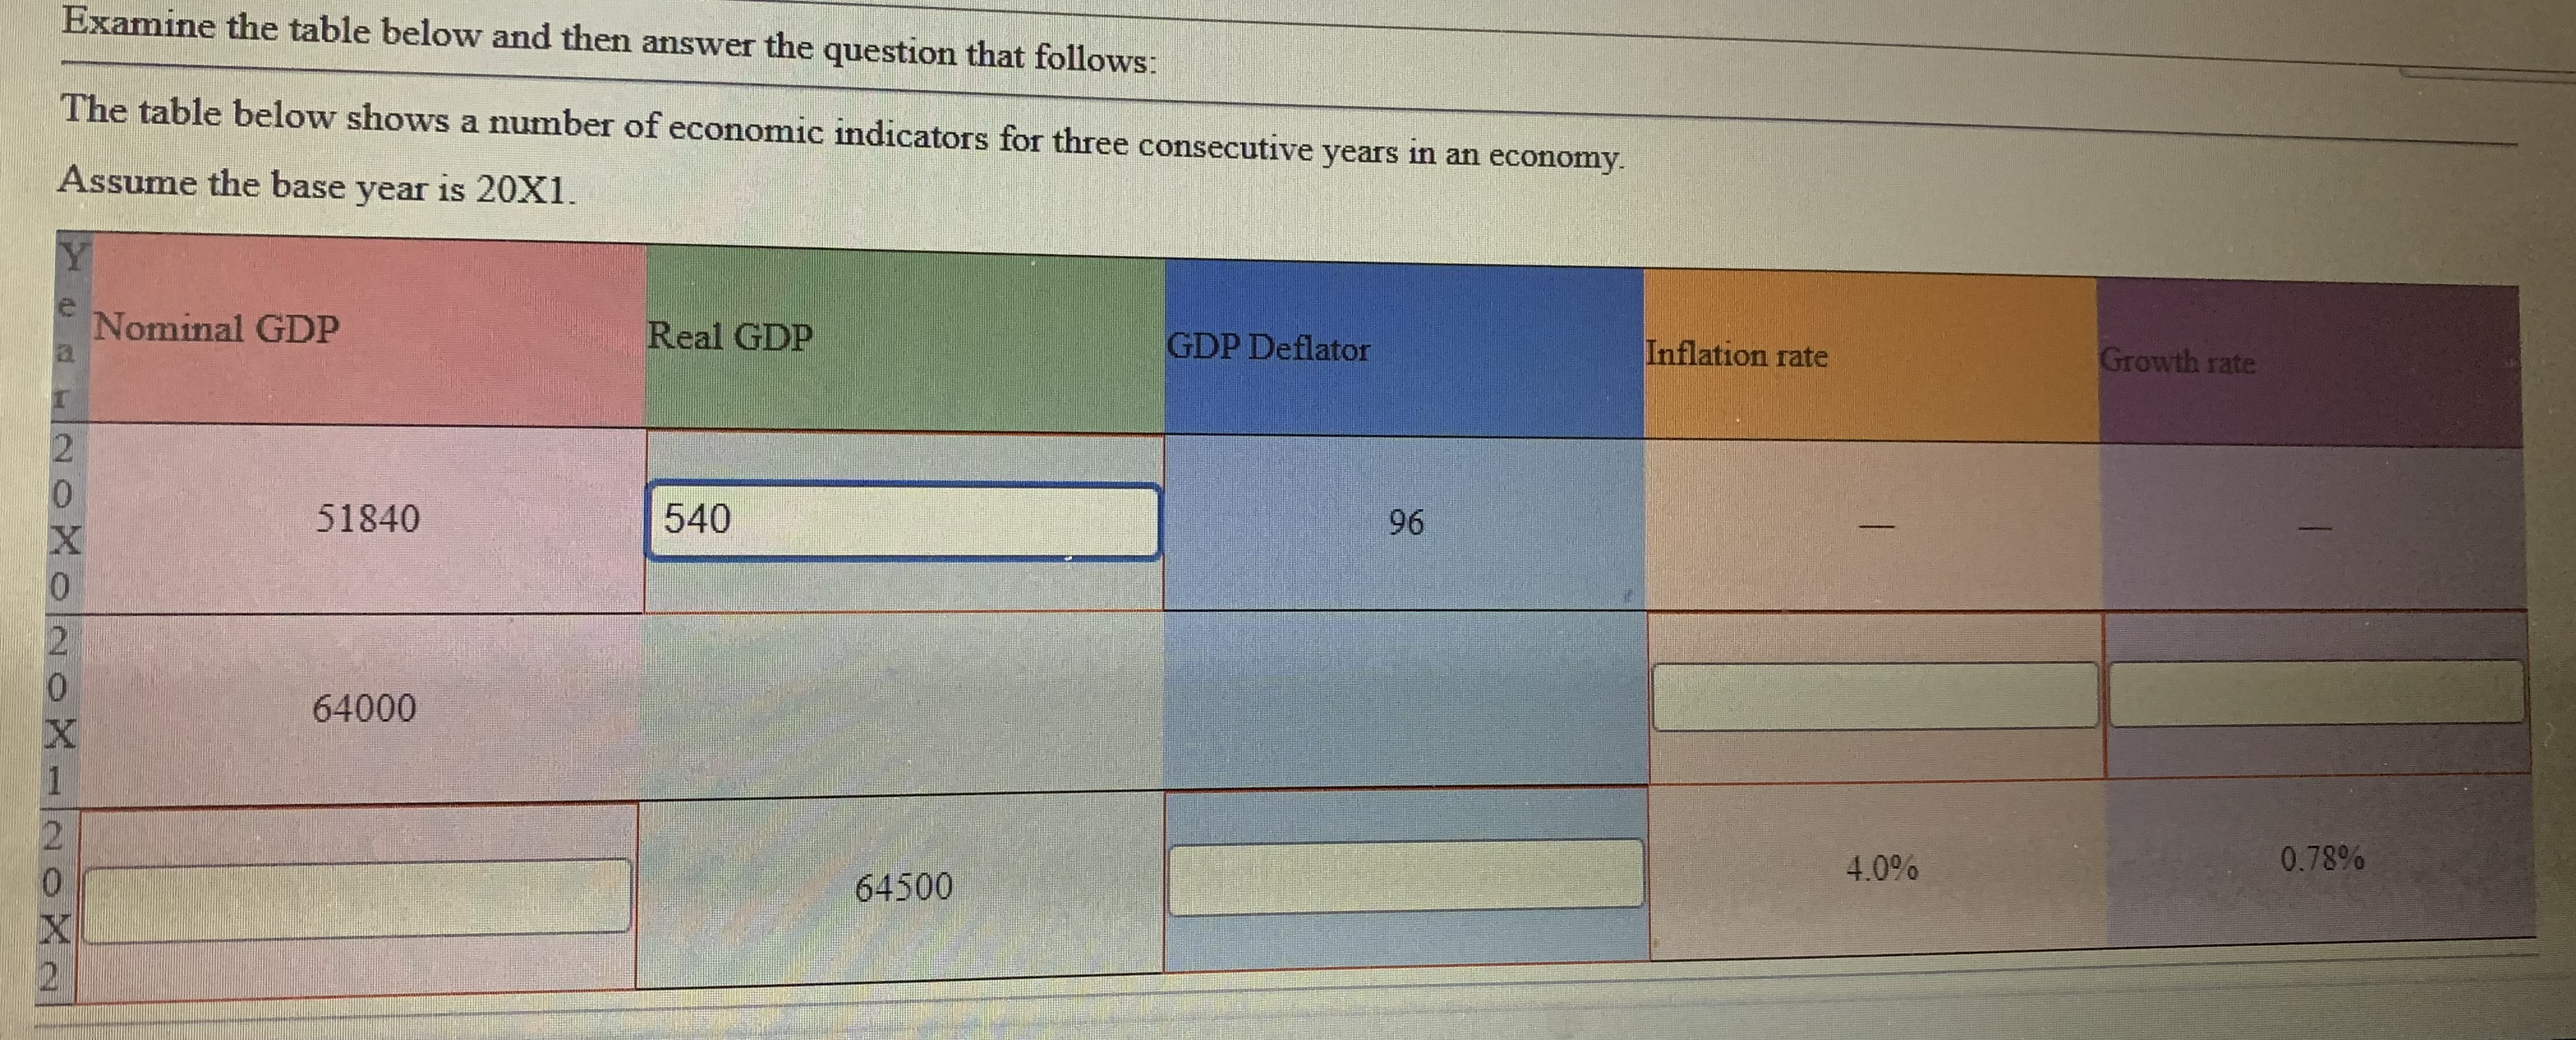

Examine the table below and then answer the question that follows: The table below shows a number of economic indicators for three consecutive years in an economy. Assume the base year is 20X1. e Nominal GDP Real GDP GDP Deflator Inflation rate Growth rate 51840 540 96 64000 4.0% 0.78% 64500
Step by Step Solution
There are 3 Steps involved in it
1 Expert Approved Answer
Step: 1 Unlock

Question Has Been Solved by an Expert!
Get step-by-step solutions from verified subject matter experts
Step: 2 Unlock
Step: 3 Unlock