

Question: Examine the tables and graphs below. Explain which main effect(s) and interaction effect(s) you see in each. Examine the table and graph below. Explain which
Examine the tables and graphs below. Explain which main effect(s) and interaction effect(s) you see in each.
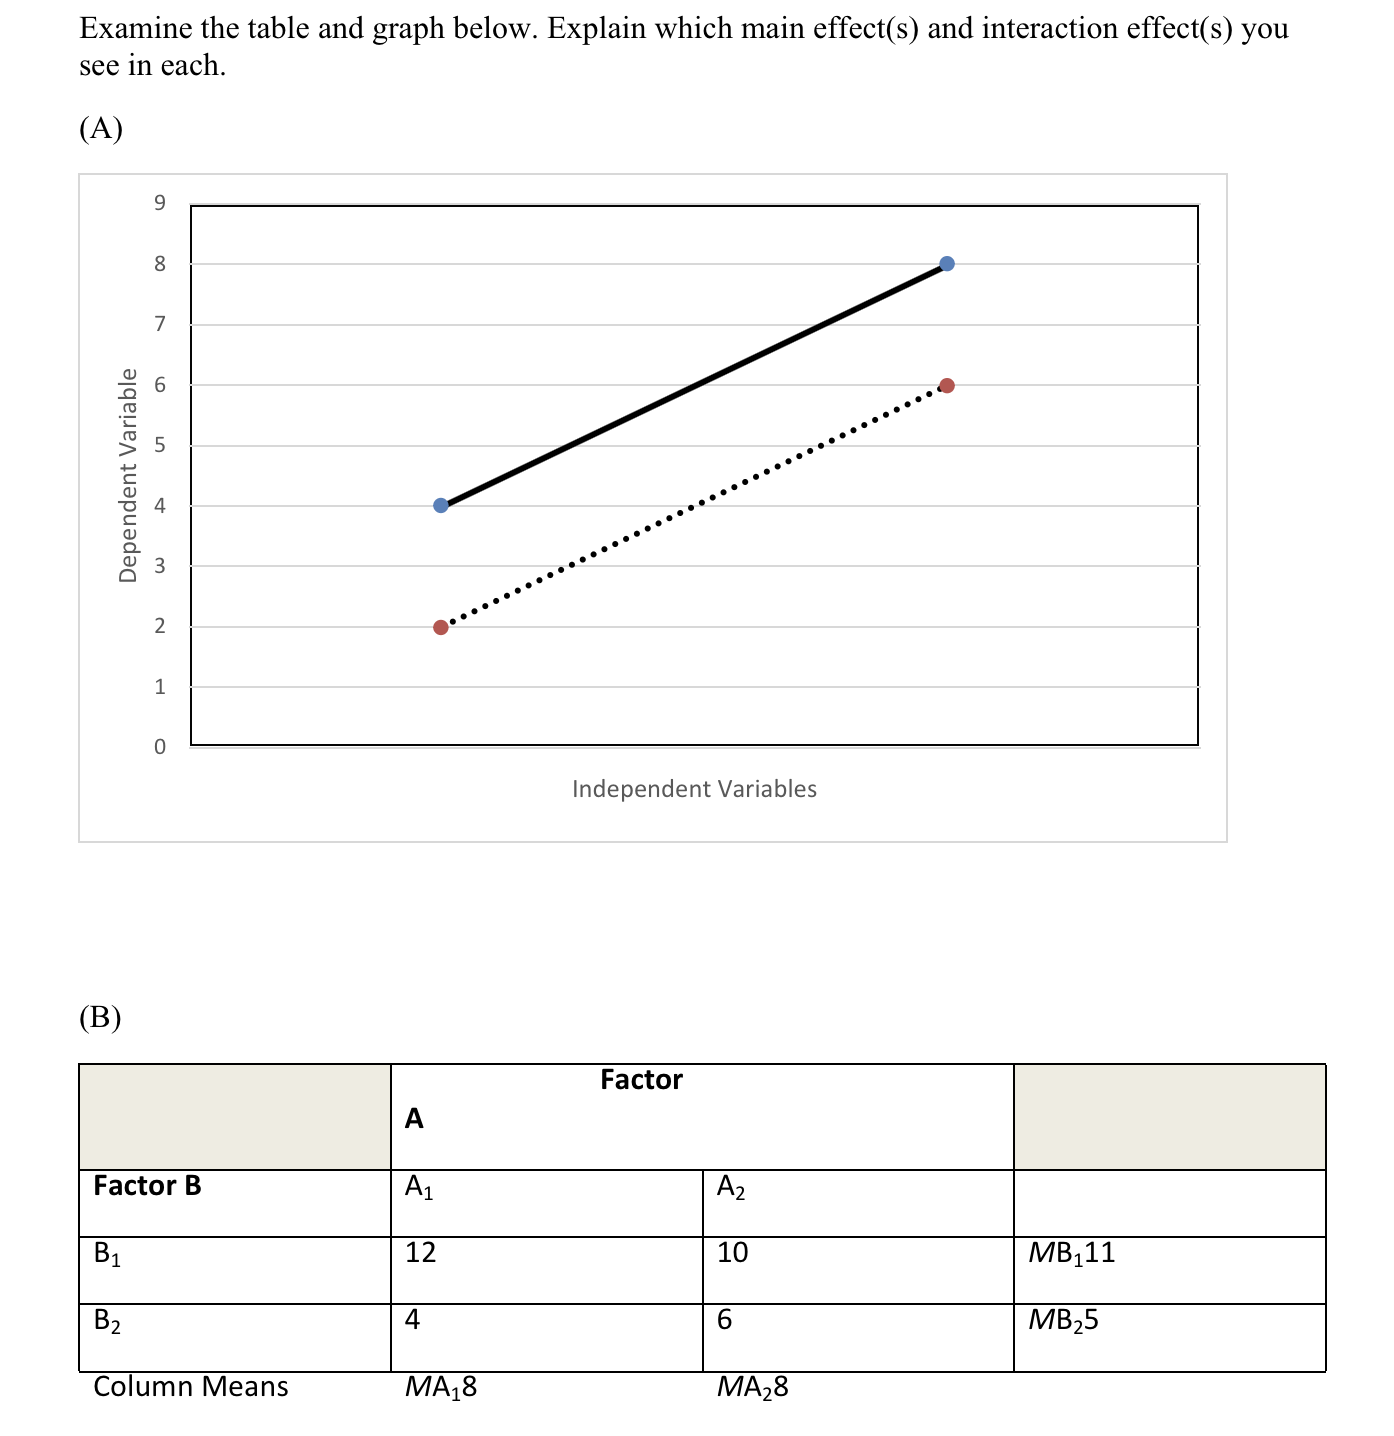
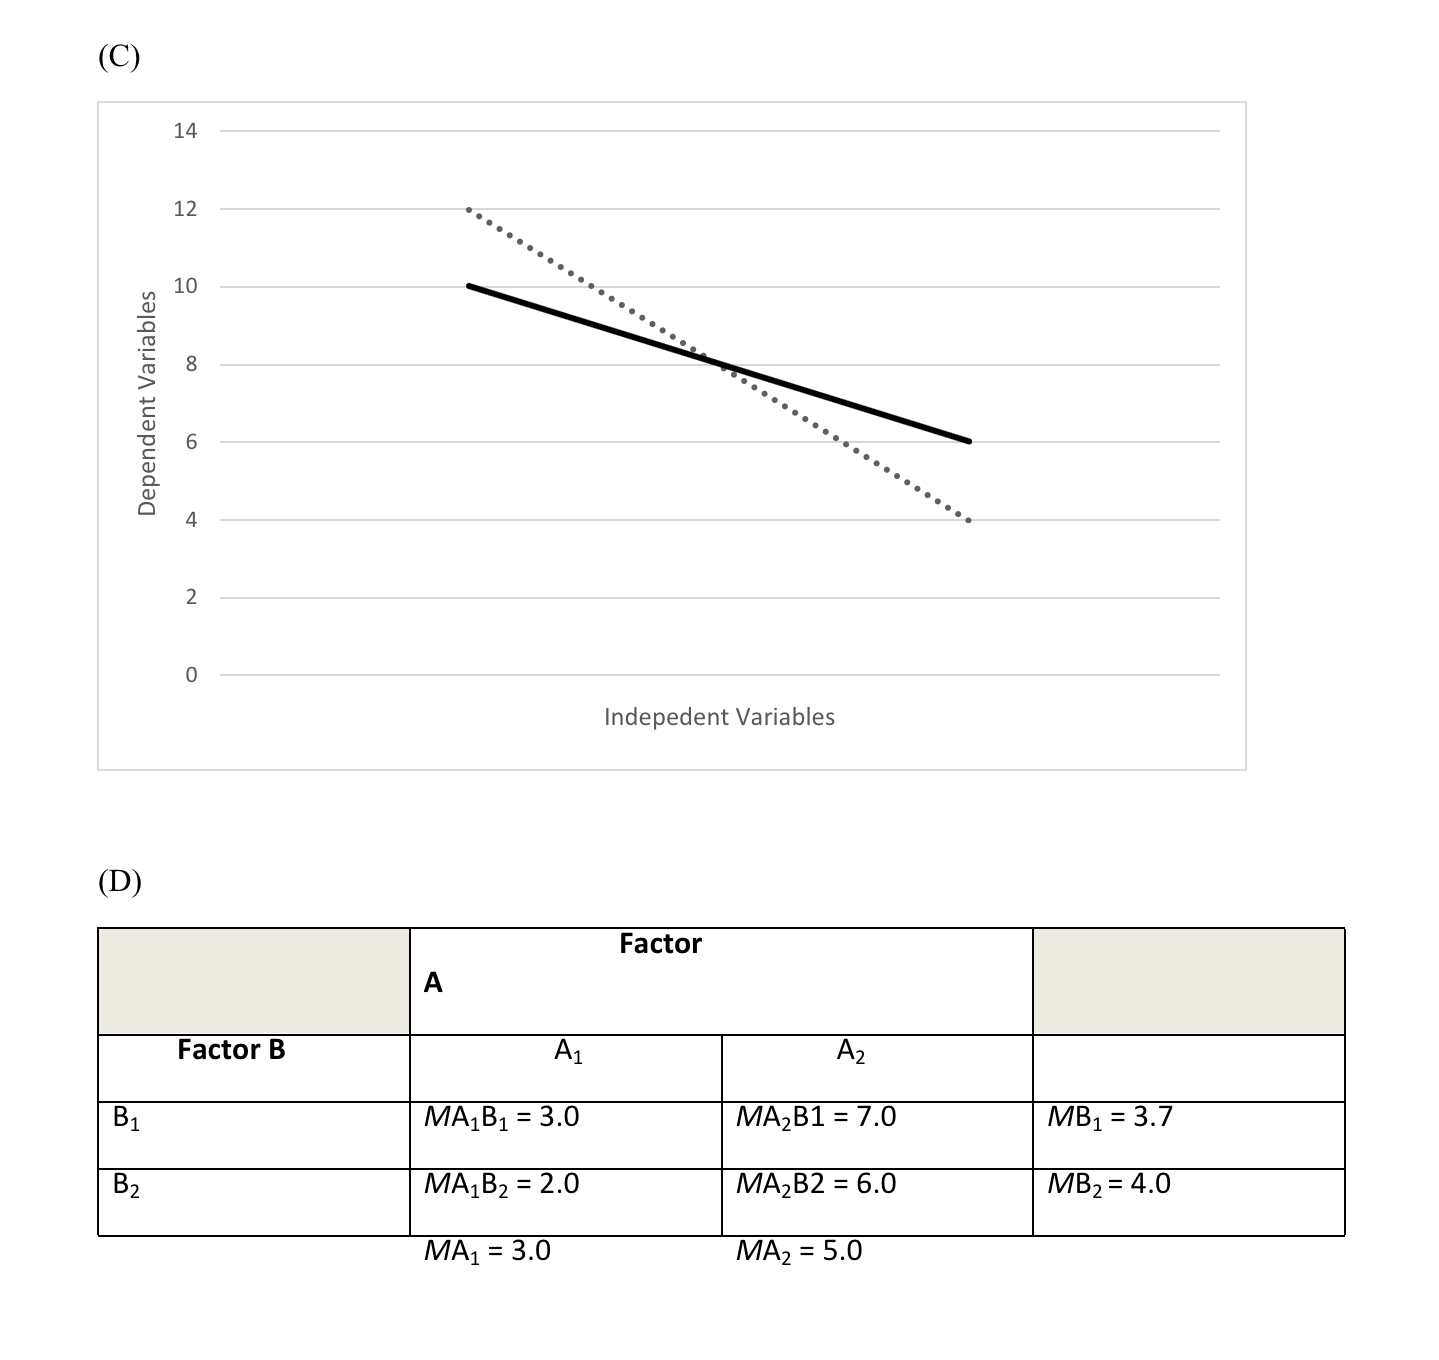
Examine the table and graph below. Explain which main effect(s) and interaction effect(s) you see in each. (A) Dependent Variable Independent Variables e~ e e r Column Means MA;8 MA,8 (C) 14 12 10 . . . . . . . . ............... 8 Dependent Variables 6 . . . . . . . . ............... A 2 0 Indepedent Variables (D) Factor A Factor B A1 A2 B1 MA, B1 = 3.0 MA2 B1 = 7.0 MB1 = 3.7 MB2 = 4.0 B 2 MA1B2 = 2.0 MA2 B2 = 6.0 MA1 = 3.0 MA2 = 5.0
Step by Step Solution
There are 3 Steps involved in it
1 Expert Approved Answer
Step: 1 Unlock

Question Has Been Solved by an Expert!
Get step-by-step solutions from verified subject matter experts
Step: 2 Unlock
Step: 3 Unlock