

Question: Example 1 (10 points) Pepsi Company produces a single article. Following cost data is given about its product:- Selling price per unit Rs.45 Marginal cost
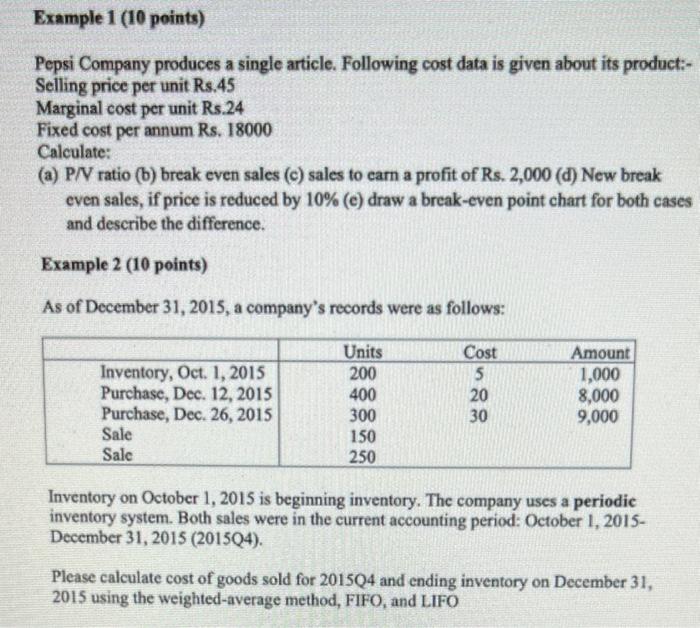
Example 1 (10 points) Pepsi Company produces a single article. Following cost data is given about its product:- Selling price per unit Rs.45 Marginal cost per unit Rs.24 Fixed cost per annum Rs. 18000 Calculate: (a) P/V ratio (b) break even sales (c) sales to earn a profit of Rs. 2,000 (d) New break even sales, if price is reduced by 10% (e) draw a break-even point chart for both cases and describe the difference. Example 2 (10 points) As of December 31, 2015, a company's records were as follows: Inventory, Oct. 1, 2015 Purchase, Dec. 12, 2015 Purchase, Dec. 26, 2015 Sale Sale Units 200 400 300 150 250 Cost 5 20 30 Amount 1,000 8,000 9,000 Inventory on October 1, 2015 is beginning inventory. The company uses a periodic inventory system. Both sales were in the current accounting period: October 1, 2015- December 31, 2015 (201504). Please calculate cost of goods sold for 201504 and ending inventory on December 31, 2015 using the weighted-average method, FIFO, and LIFO
Step by Step Solution
There are 3 Steps involved in it

Get step-by-step solutions from verified subject matter experts