

Question: Example 1 8 . 3 For the dams shown in Fig. E 1 8 . 3 , determine the quantity of seepage, the uplift pressure
Example
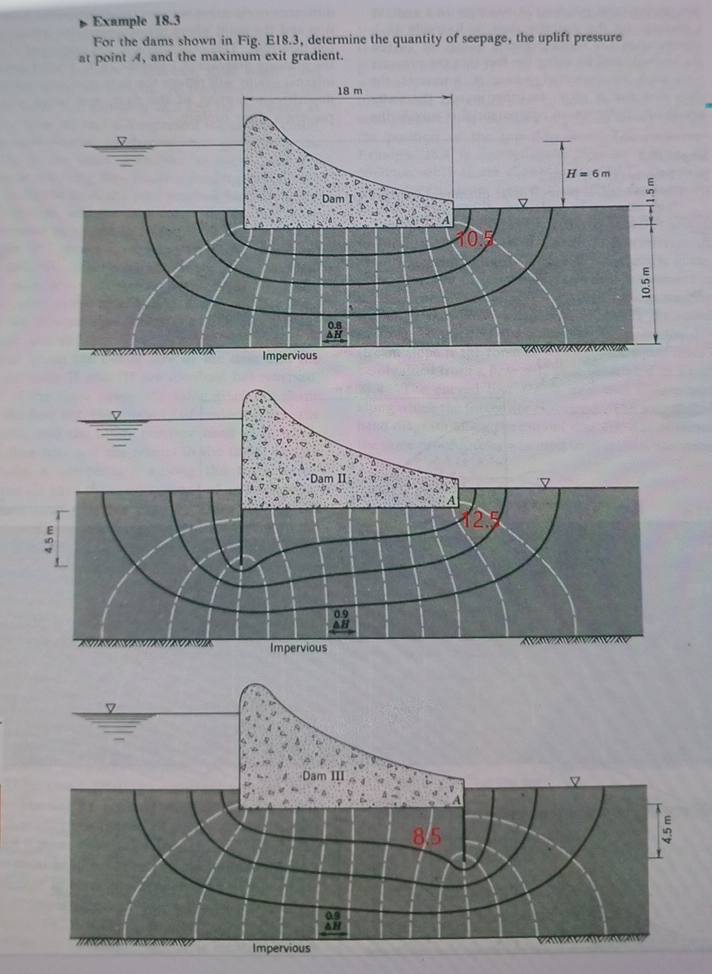
For the dams shown in Fig. E determine the quantity of seepage, the uplift pressure at point and the maximum exit gradient.
Step by Step Solution
There are 3 Steps involved in it
1 Expert Approved Answer
Step: 1 Unlock

Question Has Been Solved by an Expert!
Get step-by-step solutions from verified subject matter experts
Step: 2 Unlock
Step: 3 Unlock