

Question: Example 1: Height of Students The histogram and dotplot below both show the data for the quantitative variable Height for 355 students. a). Describe the
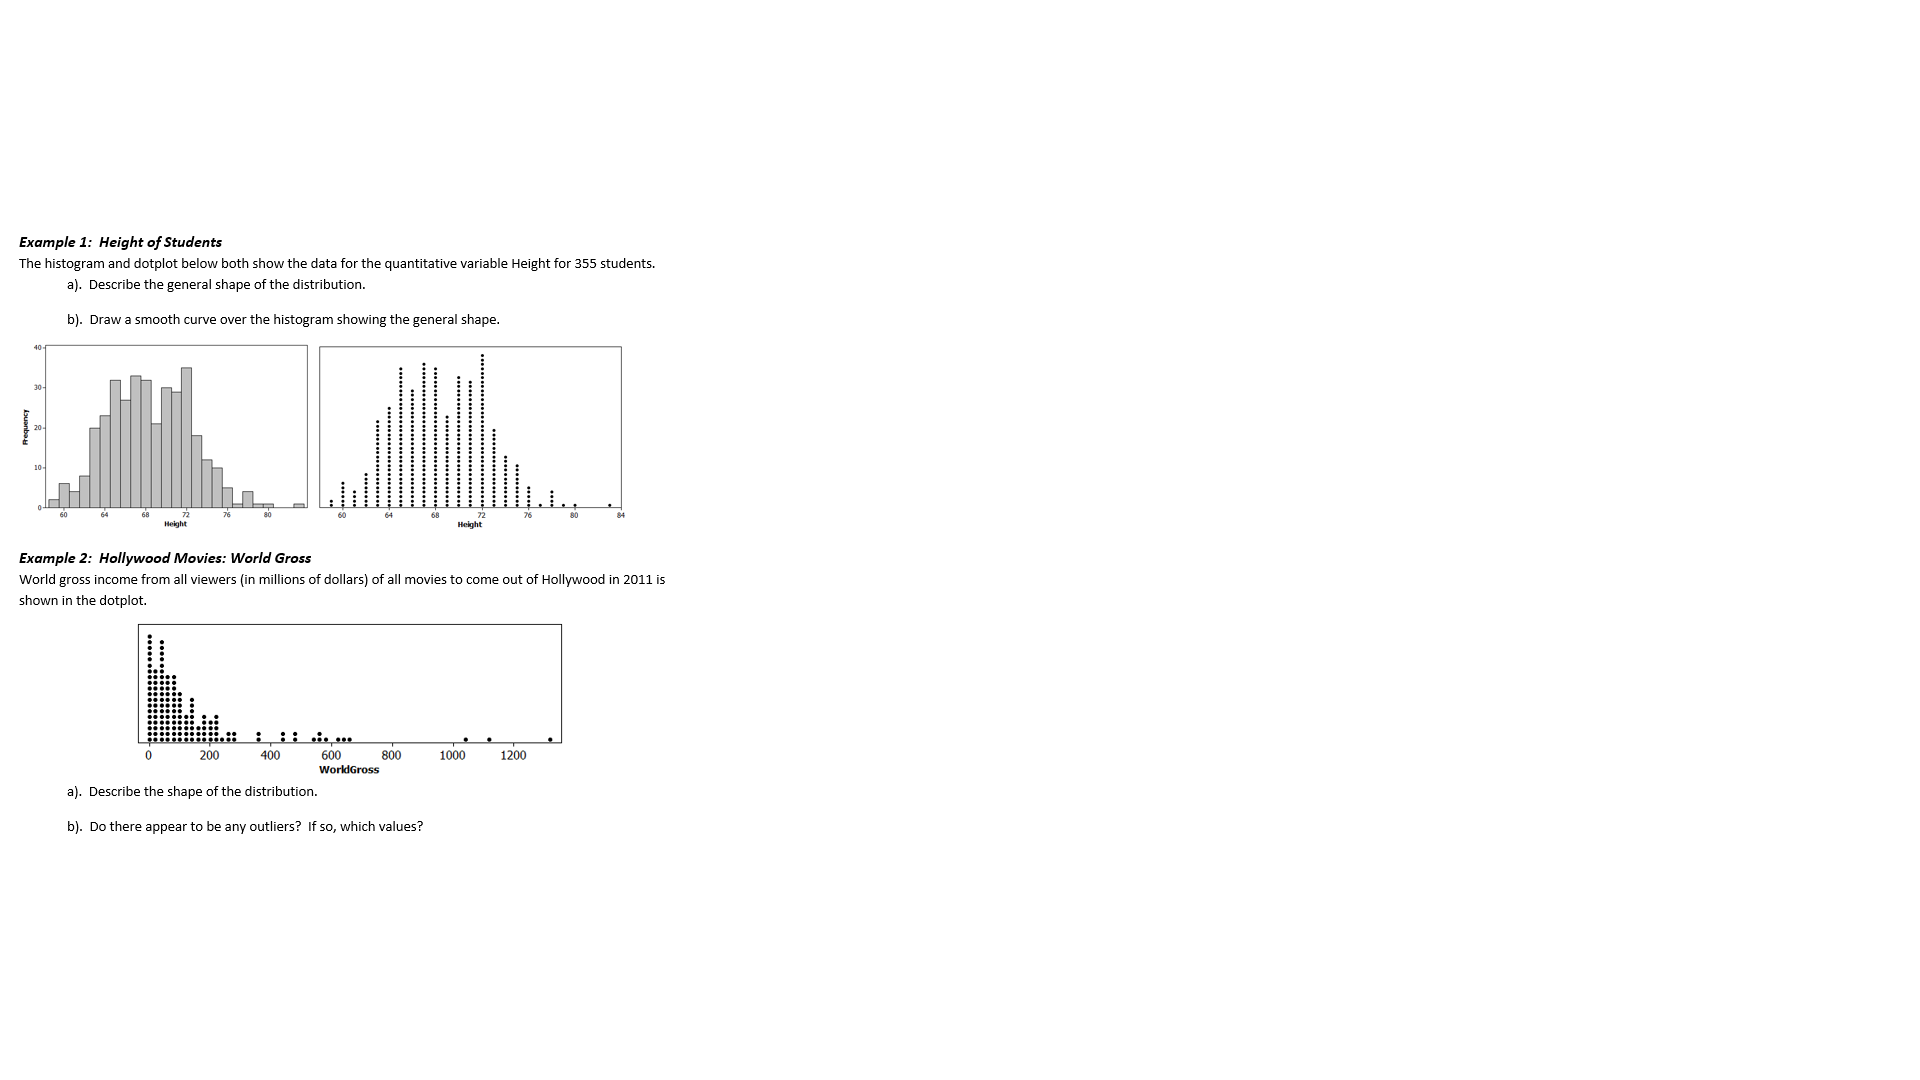
Example 1: Height of Students The histogram and dotplot below both show the data for the quantitative variable Height for 355 students. a). Describe the general shape of the distribution. b). Draw a smooth curve over the histogram showing the general shape. Height Example 2: Hollywood Movies: World Gross World gross income from all viewers (in millions of dollars) of all movies to come out of Hollywood in 2011 is shown in the dotplot. 0 200 400 600 800 1000 1200 WorldGross a). Describe the shape of the distribution. b). Do there appear to be any outliers? If so, which values
Step by Step Solution
There are 3 Steps involved in it
1 Expert Approved Answer
Step: 1 Unlock

Question Has Been Solved by an Expert!
Get step-by-step solutions from verified subject matter experts
Step: 2 Unlock
Step: 3 Unlock