

Question: Example 1 - Nave Approach Table A - Demand for Eggs During Easter Period Actual Demand Easter 2015 1.2 Million Easter 2016 1.0 Million
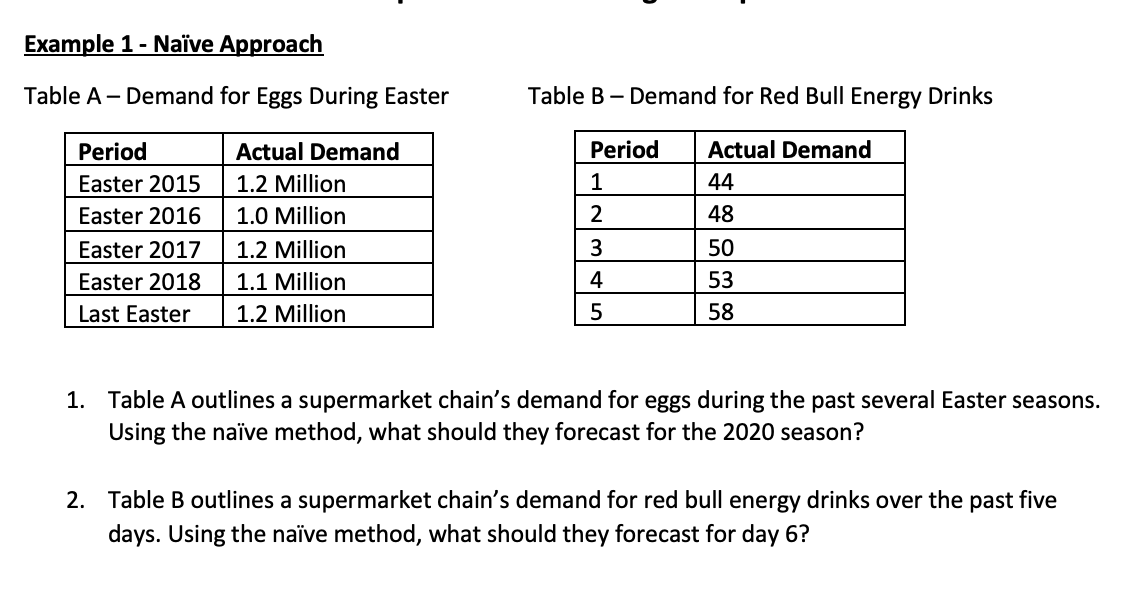
Example 1 - Nave Approach Table A - Demand for Eggs During Easter Period Actual Demand Easter 2015 1.2 Million Easter 2016 1.0 Million Easter 2017 1.2 Million Easter 2018 1.1 Million Last Easter 1.2 Million Table B-Demand for Red Bull Energy Drinks Period Actual Demand 1 44 2 48 3 50 4 53 5 58 1. Table A outlines a supermarket chain's demand for eggs during the past several Easter seasons. Using the nave method, what should they forecast for the 2020 season? 2. Table B outlines a supermarket chain's demand for red bull energy drinks over the past five days. Using the nave method, what should they forecast for day 6?
Step by Step Solution
There are 3 Steps involved in it

Get step-by-step solutions from verified subject matter experts