

Question: Example 1: Suppose the scores on a test are normally distributed, that the mean score is 80 and the standard deviation is 7. Draw a
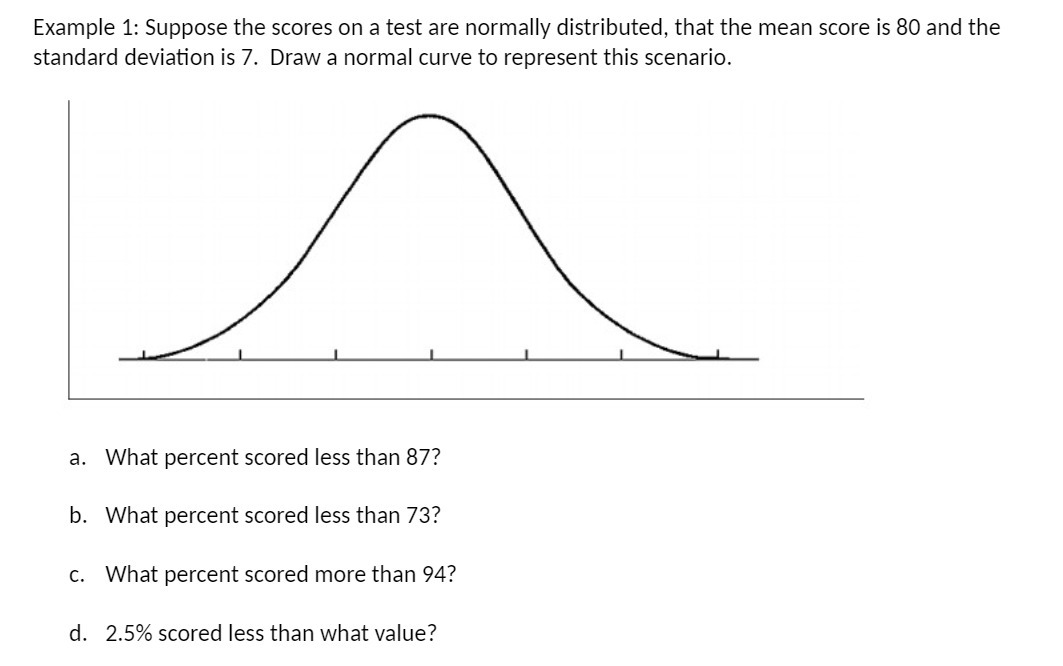
Example 1: Suppose the scores on a test are normally distributed, that the mean score is 80 and the standard deviation is 7. Draw a normal curve to represent this scenario. a. What percent scored less than 87? b. What percent scored less than 73? c. What percent scored more than 94? d. 2.5% scored less than what value
Step by Step Solution
There are 3 Steps involved in it
1 Expert Approved Answer
Step: 1 Unlock

Question Has Been Solved by an Expert!
Get step-by-step solutions from verified subject matter experts
Step: 2 Unlock
Step: 3 Unlock