

Question: Example: 1) The 2012 General Social Survey (G8 8) asked its respondents to report their political party affiliation. The graphs show the results for 879
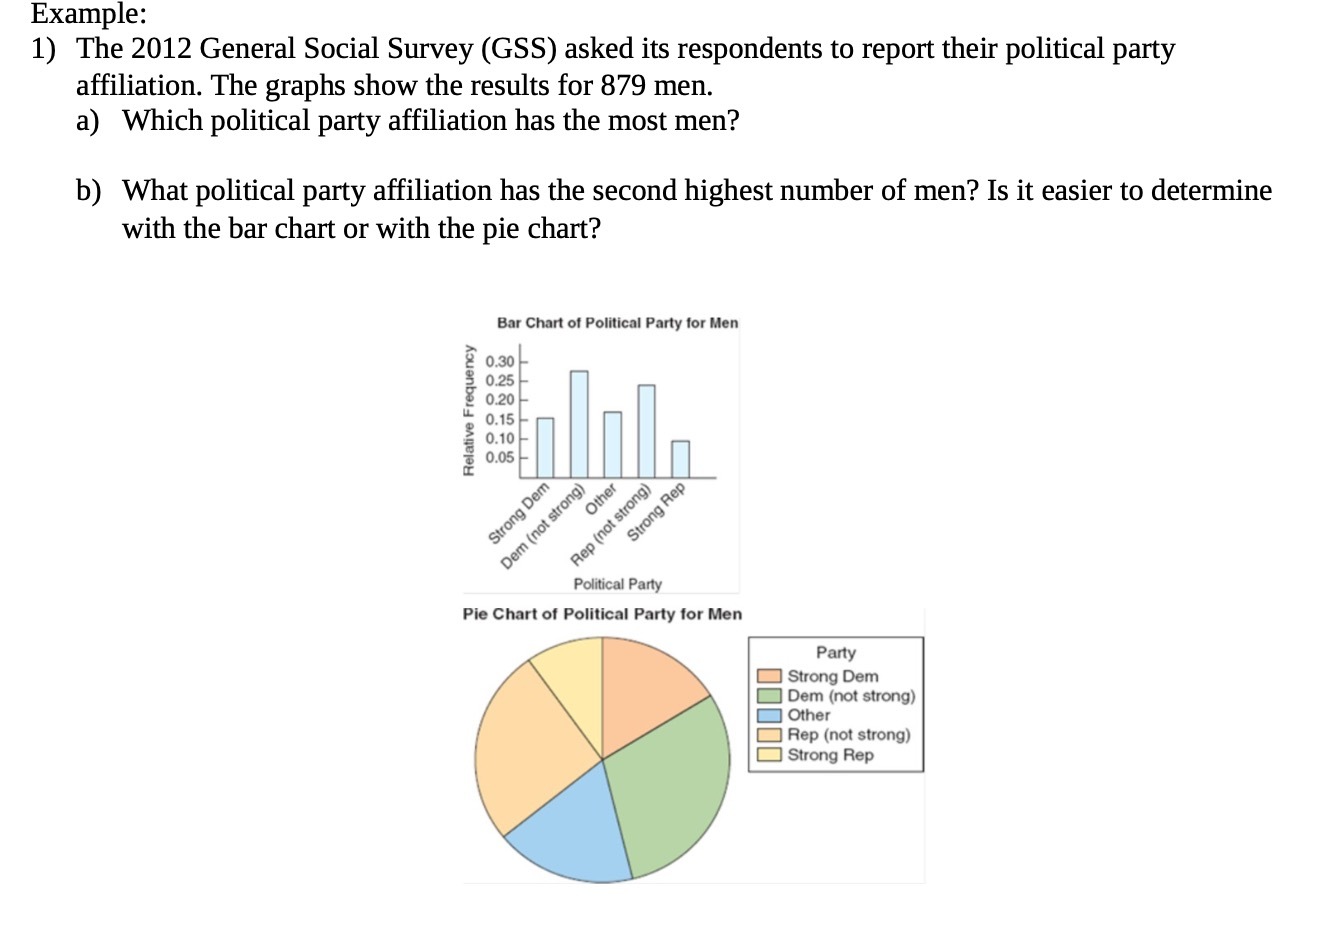
Example: 1) The 2012 General Social Survey (G8 8) asked its respondents to report their political party affiliation. The graphs show the results for 879 men. a) Which political party affiliation has the most men? b) What political party affiliation has the second highest number of men? Is it easier to determine with the bar chart or with the pie chart? "WHWP-'lybrln a? can 025 020 \"' 0.15 i 0.10 0.05 H: #33fo @9996\": mm FIG cum of Political mural-n 'P
Step by Step Solution
There are 3 Steps involved in it
1 Expert Approved Answer
Step: 1 Unlock

Question Has Been Solved by an Expert!
Get step-by-step solutions from verified subject matter experts
Step: 2 Unlock
Step: 3 Unlock