

Question: Example 13.2 Consider the error data of Example 12.5, which was shown to have a normal distribution. The eight error values are -0.04,-0.19, 0.14,-0.09, -0.14,
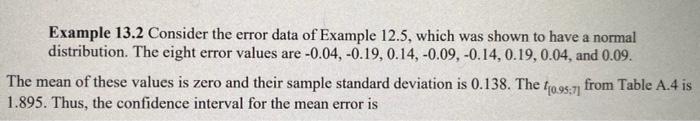
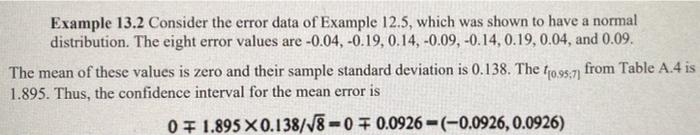
Example 13.2 Consider the error data of Example 12.5, which was shown to have a normal distribution. The eight error values are -0.04,-0.19, 0.14,-0.09, -0.14, 0.19, 0.04, and 0.09. The mean of these values is zero and their sample standard deviation is 0.138. The 11095:7, from Table A.4 is 1.895. Thus, the confidence interval for the mean error is Example 13.2 Consider the error data of Example 12.5, which was shown to have a normal distribution. The eight error values are -0.04,-0.19, 0.14,-0.09, -0.14, 0.19, 0.04, and 0.09. The mean of these values is zero and their sample standard deviation is 0.138. The 110.95:7, from Table A.4 is 1.895. Thus, the confidence interval for the mean error is 0 F 1.895 X 0.138/18 - 0 F 0.0926-(-0.0926, 0.0926) Example 13.2 Consider the error data of Example 12.5, which was shown to have a normal distribution. The eight error values are -0.04,-0.19, 0.14,-0.09, -0.14, 0.19, 0.04, and 0.09. The mean of these values is zero and their sample standard deviation is 0.138. The 11095:7, from Table A.4 is 1.895. Thus, the confidence interval for the mean error is Example 13.2 Consider the error data of Example 12.5, which was shown to have a normal distribution. The eight error values are -0.04,-0.19, 0.14,-0.09, -0.14, 0.19, 0.04, and 0.09. The mean of these values is zero and their sample standard deviation is 0.138. The 110.95:7, from Table A.4 is 1.895. Thus, the confidence interval for the mean error is 0 F 1.895 X 0.138/18 - 0 F 0.0926-(-0.0926, 0.0926)
Step by Step Solution
There are 3 Steps involved in it

Get step-by-step solutions from verified subject matter experts