

Question: Example 2 A process leads to the measures presented in the table below. The standard deviation of the process is 0 . 0 5 '
Example
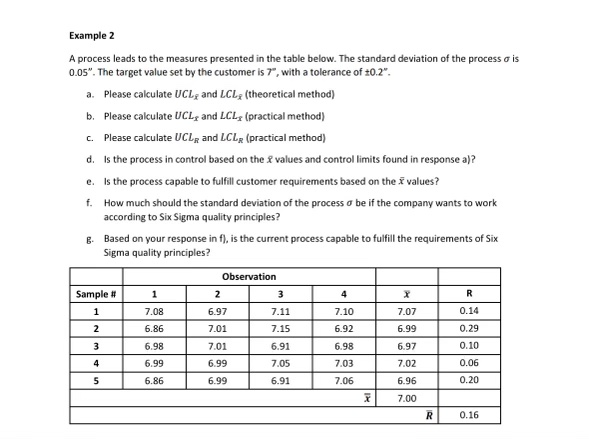
A process leads to the measures presented in the table below. The standard deviation of the process is The target value set by the customer is with a tolerance of
a Please calculate and theoretical method
b Please calculate and practical method
c Please calculate and practical method
d Is the process in control based on the values and control limits found in response a
e Is the process capable to fulfill customer requirements based on the values?
f How much should the standard deviation of the process be if the company wants to work according to Six Sigma quality principles?
g Based on your response in is the current process capable to fulfill the requirements of Six Sigma quality principles?
tableSample #Observation,bar xRbar xbar R
Step by Step Solution
There are 3 Steps involved in it
1 Expert Approved Answer
Step: 1 Unlock

Question Has Been Solved by an Expert!
Get step-by-step solutions from verified subject matter experts
Step: 2 Unlock
Step: 3 Unlock