

Question: Example 3.1-Drawdown Semilog Analysis. The following example illustrates the procedure for analyzing a constant-rate drawdown test using semilog analysis. Problem. oven the rock and fluid
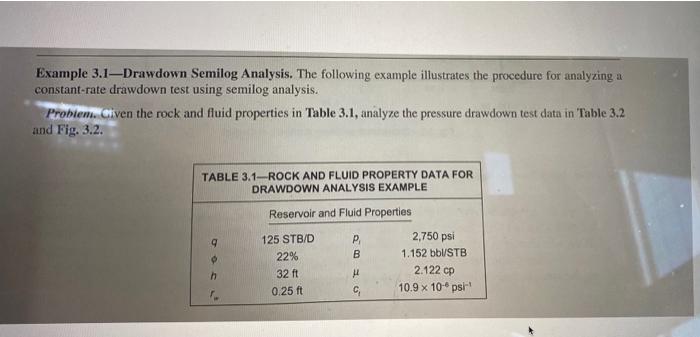
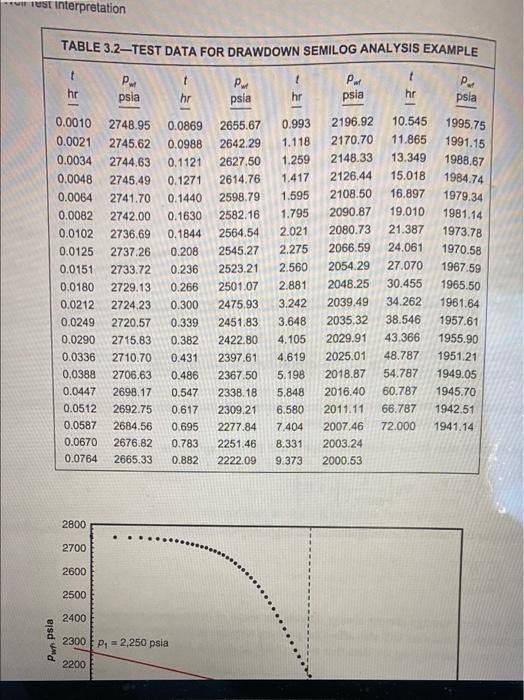
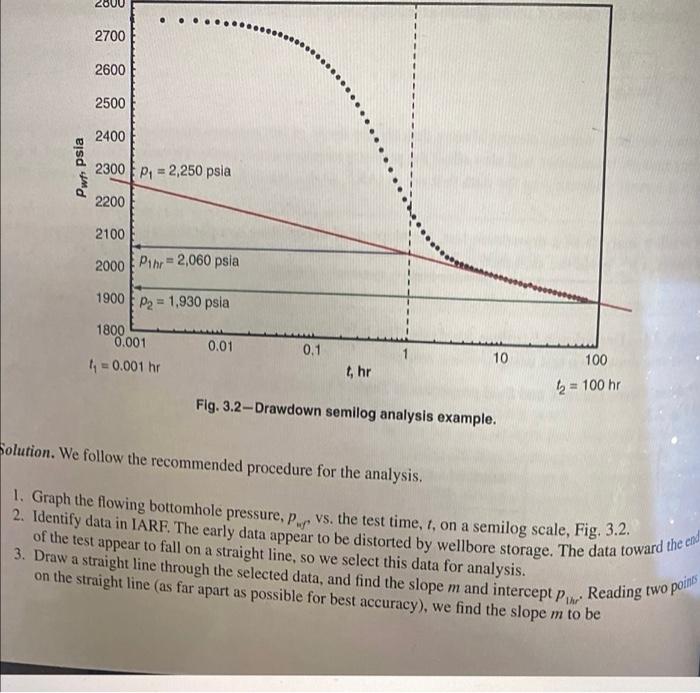
Example 3.1-Drawdown Semilog Analysis. The following example illustrates the procedure for analyzing a constant-rate drawdown test using semilog analysis. Problem. oven the rock and fluid properties in Table 3.1, analyze the pressure drawdown test data in "Table 3.2 and Fig. 3.2. TABLE 3.1-ROCK AND FLUID PROPERTY DATA FOR DRAWDOWN ANALYSIS EXAMPLE Reservoir and Fluid Properties B 125 STB/D 22% 32 ft 0.25 ft 2,750 psi 1.152 bb\/STB 2.122 cp 10.9 x 10-ps est interpretation TABLE 3.2TEST DATA FOR DRAWDOWN SEMILOG ANALYSIS EXAMPLE t Por P. psia hr t hr Pue psia t hr hr psia .. psla 1 0.0010 0.0021 0.0034 0.0048 0.0064 0.0082 0.0102 0.0125 0.0151 0.0180 0.0212 0.0249 0.0290 0.0336 0.0388 0.0447 0.0512 0.0587 0.0670 0.0764 2748.95 2745.62 2744.63 2745.49 2741.70 2742.00 2736.69 2737.26 2733.72 2729.13 2724.23 2720.57 2715.83 2710.70 2706.63 2698.17 2692.75 2684.56 2676.82 2665.33 0.0869 0.0988 0.1121 0.1271 0.1440 0.1630 0.1844 0.208 0.236 0.266 0.300 0.339 0.382 0.431 0.486 0.547 0.617 0.695 0.783 0.882 2655.67 2642.29 2627.50 2614.76 2598.79 2582.16 2564.54 2545.27 2523.21 2501.07 2475.93 2451.83 2422.80 2397.61 2367.50 2338.18 2309.21 2277.84 2251.46 2222.09 0.993 1.118 1.259 1.417 1.595 1.795 2.021 2.275 2.560 2.881 3.242 2196.92 10.545 2170.70 11.865 2148.33 13.349 2126,44 15.018 2108.50 16.897 2090.87 19.010 2080.73 21.387 2066.59 24.061 2054.29 27.070 2048.25 30.455 2039.49 34.262 2035.32 38.546 2029.91 43.366 2025.01 48.787 2018.87 54.787 2016.40 60.787 2011.11 66.787 1942.51 2007.46 72.000 1941.14 2003.24 2000.53 1995.75 1991.15 1988.67 1984.74 1979.34 1981.14 1973.78 1970.58 1967.59 1965.50 1961.64 1957.61 1955.90 1951.21 1949.05 1945.70 3.648 4.105 4.619 5.198 5.848 6.580 7,404 8.331 9.373 2800 . . 2700 2600 2500 2400 Pun psia 2300P, 2,250 psia 2200 2700 2600 2500 2400 Pwt psia 2300 Pa = 2,250 psla 2200 2100 2000 Puhr = 2,060 psia 1900 Pa = 1,930 psia 1800 0.001 0.01 1 = 0.001 hr 0.1 10 1, hr 100 b = 100 hr Fig. 3.2-Drawdown semilog analysis example. Solution. We follow the recommended procedure for the analysis, 1. Graph the flowing bottomhole pressure, P.,vs, the test time, t, on a semilog scale, Fig. 3.2. 2. Identify data in IARF. The early data appear to be distorted by wellbore storage. The data toward the end of the test appear to fall on a straight line, so we select this data for analysis. 3. Draw a straight line through the selected data, and find the slope m and intercept Pin on the straight line (as far apart as possible for best accuracy), we find the slope m to be Reading two points Example 3.1-Drawdown Semilog Analysis. The following example illustrates the procedure for analyzing a constant-rate drawdown test using semilog analysis. Problem. oven the rock and fluid properties in Table 3.1, analyze the pressure drawdown test data in "Table 3.2 and Fig. 3.2. TABLE 3.1-ROCK AND FLUID PROPERTY DATA FOR DRAWDOWN ANALYSIS EXAMPLE Reservoir and Fluid Properties B 125 STB/D 22% 32 ft 0.25 ft 2,750 psi 1.152 bb\/STB 2.122 cp 10.9 x 10-ps est interpretation TABLE 3.2TEST DATA FOR DRAWDOWN SEMILOG ANALYSIS EXAMPLE t Por P. psia hr t hr Pue psia t hr hr psia .. psla 1 0.0010 0.0021 0.0034 0.0048 0.0064 0.0082 0.0102 0.0125 0.0151 0.0180 0.0212 0.0249 0.0290 0.0336 0.0388 0.0447 0.0512 0.0587 0.0670 0.0764 2748.95 2745.62 2744.63 2745.49 2741.70 2742.00 2736.69 2737.26 2733.72 2729.13 2724.23 2720.57 2715.83 2710.70 2706.63 2698.17 2692.75 2684.56 2676.82 2665.33 0.0869 0.0988 0.1121 0.1271 0.1440 0.1630 0.1844 0.208 0.236 0.266 0.300 0.339 0.382 0.431 0.486 0.547 0.617 0.695 0.783 0.882 2655.67 2642.29 2627.50 2614.76 2598.79 2582.16 2564.54 2545.27 2523.21 2501.07 2475.93 2451.83 2422.80 2397.61 2367.50 2338.18 2309.21 2277.84 2251.46 2222.09 0.993 1.118 1.259 1.417 1.595 1.795 2.021 2.275 2.560 2.881 3.242 2196.92 10.545 2170.70 11.865 2148.33 13.349 2126,44 15.018 2108.50 16.897 2090.87 19.010 2080.73 21.387 2066.59 24.061 2054.29 27.070 2048.25 30.455 2039.49 34.262 2035.32 38.546 2029.91 43.366 2025.01 48.787 2018.87 54.787 2016.40 60.787 2011.11 66.787 1942.51 2007.46 72.000 1941.14 2003.24 2000.53 1995.75 1991.15 1988.67 1984.74 1979.34 1981.14 1973.78 1970.58 1967.59 1965.50 1961.64 1957.61 1955.90 1951.21 1949.05 1945.70 3.648 4.105 4.619 5.198 5.848 6.580 7,404 8.331 9.373 2800 . . 2700 2600 2500 2400 Pun psia 2300P, 2,250 psia 2200 2700 2600 2500 2400 Pwt psia 2300 Pa = 2,250 psla 2200 2100 2000 Puhr = 2,060 psia 1900 Pa = 1,930 psia 1800 0.001 0.01 1 = 0.001 hr 0.1 10 1, hr 100 b = 100 hr Fig. 3.2-Drawdown semilog analysis example. Solution. We follow the recommended procedure for the analysis, 1. Graph the flowing bottomhole pressure, P.,vs, the test time, t, on a semilog scale, Fig. 3.2. 2. Identify data in IARF. The early data appear to be distorted by wellbore storage. The data toward the end of the test appear to fall on a straight line, so we select this data for analysis. 3. Draw a straight line through the selected data, and find the slope m and intercept Pin on the straight line (as far apart as possible for best accuracy), we find the slope m to be Reading two points
Step by Step Solution
There are 3 Steps involved in it

Get step-by-step solutions from verified subject matter experts