

Question: Example 4) The figure below is a representation of a manufacturing process producing two products labeled P and Q. product P is sold for $90
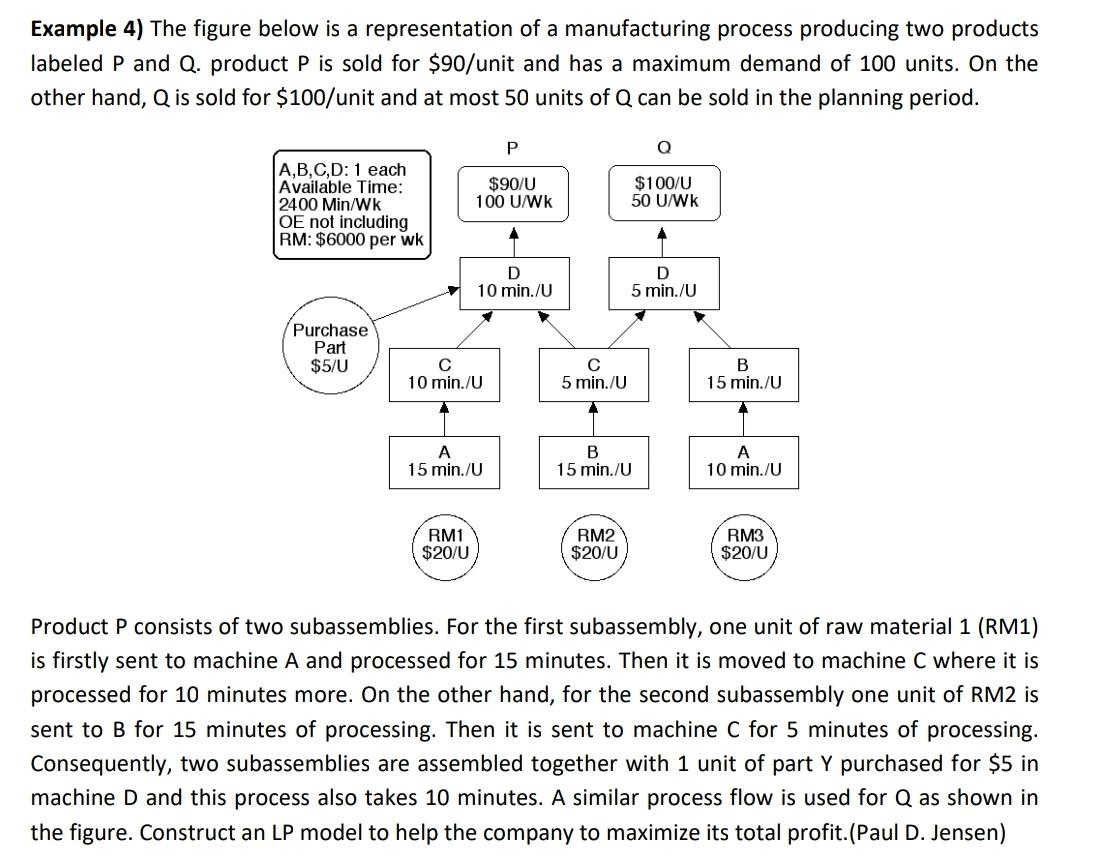
Example 4) The figure below is a representation of a manufacturing process producing two products labeled P and Q. product P is sold for $90 /unit and has a maximum demand of 100 units. On the other hand, Q is sold for $100 /unit and at most 50 units of Q can be sold in the planning period. Product P consists of two subassemblies. For the first subassembly, one unit of raw material 1 (RM1) is firstly sent to machine A and processed for 15 minutes. Then it is moved to machine C where it is processed for 10 minutes more. On the other hand, for the second subassembly one unit of RM is sent to B for 15 minutes of processing. Then it is sent to machine C for 5 minutes of processing. Consequently, two subassemblies are assembled together with 1 unit of part Y purchased for $5 in machine D and this process also takes 10 minutes. A similar process flow is used for Q as shown in the figure. Construct an LP model to help the company to maximize its total profit.(Paul D. Jensen) Example 4) The figure below is a representation of a manufacturing process producing two products labeled P and Q. product P is sold for $90 /unit and has a maximum demand of 100 units. On the other hand, Q is sold for $100 /unit and at most 50 units of Q can be sold in the planning period. Product P consists of two subassemblies. For the first subassembly, one unit of raw material 1 (RM1) is firstly sent to machine A and processed for 15 minutes. Then it is moved to machine C where it is processed for 10 minutes more. On the other hand, for the second subassembly one unit of RM is sent to B for 15 minutes of processing. Then it is sent to machine C for 5 minutes of processing. Consequently, two subassemblies are assembled together with 1 unit of part Y purchased for $5 in machine D and this process also takes 10 minutes. A similar process flow is used for Q as shown in the figure. Construct an LP model to help the company to maximize its total profit.(Paul D. Jensen)
Step by Step Solution
There are 3 Steps involved in it

Get step-by-step solutions from verified subject matter experts