

Question: Example 4 Video Example () Suppose the odometer on our car is broken and we want to estimate the distance driven over a 30 second
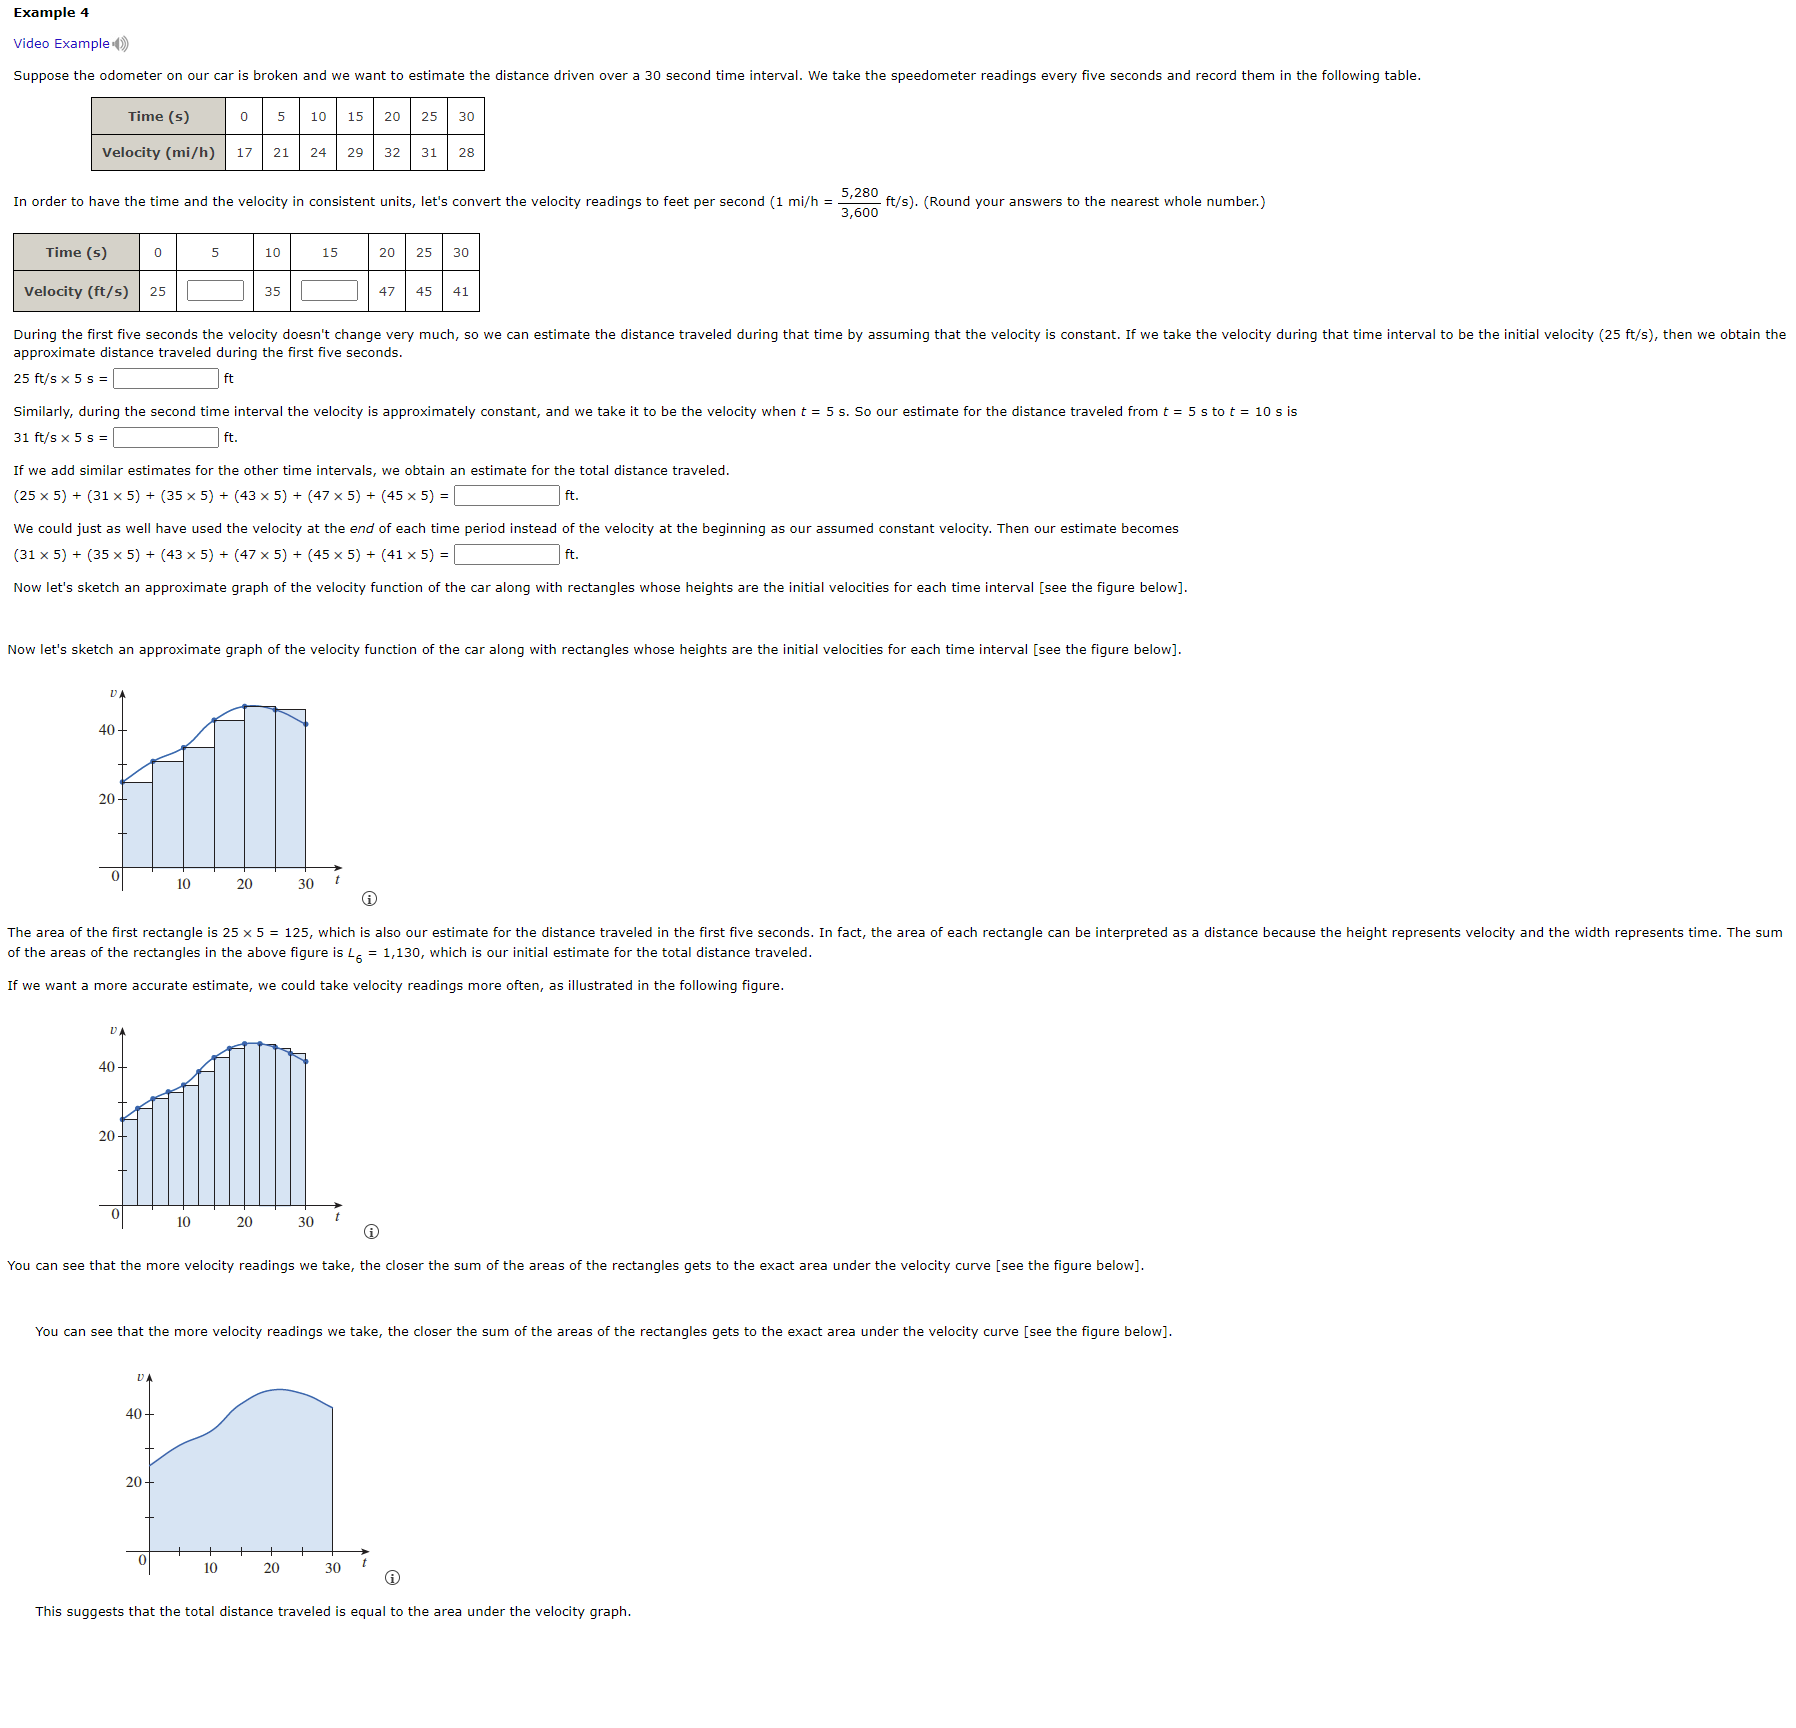

Example 4 Video Example () Suppose the odometer on our car is broken and we want to estimate the distance driven over a 30 second time interval. We take the speedometer readings every five seconds and record them in the following table. Time ( 5 ) 0 5 10 15 20 25 30 Velocity ( mi/h) 17 21 24 29 32 31 28 In order to have the time and the velocity in consistent units, let's convert the velocity readings to feet per second (1 mi/h = ft/s). (Round your answers to the nearest whole number.) Time (5) 10 15 Velocity (ft/s) 25 35 During the first five seconds the velocity doesn't change very much, so we can estimate the distance traveled during that time by assuming that the velocity is constant. If we take the velocity during that time interval to be the initial velocity (25 ft/s), then we obtain the approximate distance traveled during the first five seconds. 25 ft/s x 5 s =[ Similarly, during the second time interval the velocity is approximately constant, and we take it to be the velocity when t = 5 s. So our estimate for the distance traveled from t = 5 s to t = 10 s is 31 ft/s x 5 s = ft. If we add similar estimates for the other time intervals, we obtain an estimate for the total distance traveled. (25 x 5) + (31 x 5) + (35 x 5) + (43 x 5) + (4 We could just as well have used the velocity at the end of each time period instead of the velocity at the beginning as our assumed constant velocity. Then our estimate becomes (31 x 5) + (35 x 5) + (43 x 5) + (47 x 5) + (45 x 5) + (41 x 5) = Now let's sketch an approximate graph of the e velocity function of the car along with rectangles whose heights are the initial velocities for each time interval [see the figure below]. Now let's sketch an approximate graph of the velocity function of the car along with rectangles whose heights are the initial velocities for each time interval [see the figure below]. 40 20 30 The area of the first rectangle is 25 x 5 = 125, which is also our estimate for the distance traveled in the first five seconds. In fact, the area of each rectangle can be interpreted as a distance because the height represents velocity and the width represents time. The sum of the areas of the rectangles in the above figure is Lo = 1,130, which is our initial estimate for the total distance traveled. If we want a more accurate estimate, we could take velocity readings more often, as illustrated in the following figure. You can see that the more velocity readings we take, the closer the sum of the areas of the rectangles gets to the exact area under the velocity curve [see the figure below]. You can see that the more velocity readings we take, the closer the sum of the areas of the rectangles gets to the exact area under the velocity curve [see the figure below]. 40+ 10 20 30 A This suggests that the total distance traveled is equal to the area under the velocity graph
Step by Step Solution
There are 3 Steps involved in it

Get step-by-step solutions from verified subject matter experts