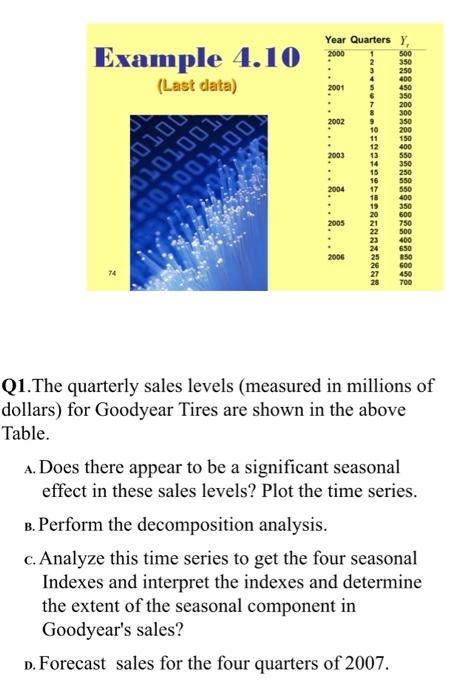
Question: Example 4.10 (Last data) 350 300 Year Quarters Y 2000 500 350 3 250 4 400 2001 450 6 7 200 2002 350 10 200

Example 4.10 (Last data) 350 300 Year Quarters Y
Example 4.10 (Last data) 350 300 Year Quarters Y 2000 500 350 3 250 4 400 2001 450 6 7 200 2002 350 10 200 11 150 12 400 2003 13 550 14 350 15 250 16 550 2004 17 550 18 400 19 350 20 600 2005 21 750 22 400 24 650 2006 25 850 26 600 27 450 28 700 111 101001 2001001100) 5 Tsiet=h 74 Q1.The quarterly sales levels (measured in millions of dollars) for Goodyear Tires are shown in the above Table. A. Does there appear to be a significant seasonal effect in these sales levels? Plot the time series. B. Perform the decomposition analysis. c. Analyze this time series to get the four seasonal Indexes and interpret the indexes and determine the extent of the seasonal component in Goodyear's sales? D. Forecast sales for the four quarters of 2007

Step by Step Solution

There are 3 Steps involved in it

1 Expert Approved Answer
Step: 1 Unlock blur-text-image
Question Has Been Solved by an Expert!

Get step-by-step solutions from verified subject matter experts

Step: 2 Unlock
Step: 3 Unlock

Students Have Also Explored These Related General Management Questions!