

Question: EXAMPLE 5. Diabetes 2. For the Diabetes data on characteristics of members of the Othama (Pima Indian) population, treat the data as a population. (a)
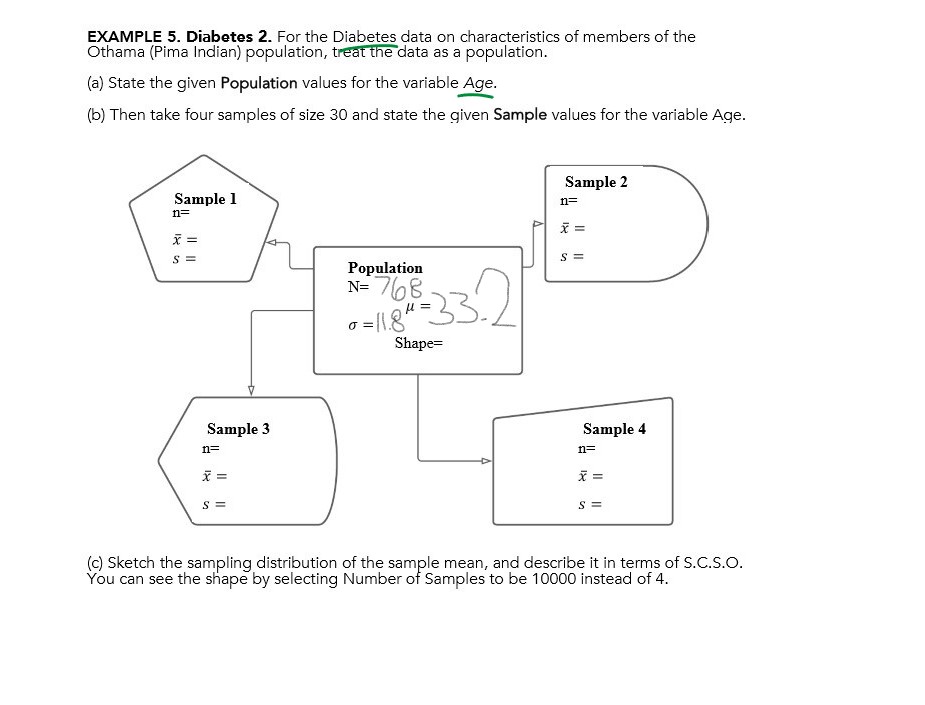
EXAMPLE 5. Diabetes 2. For the Diabetes data on characteristics of members of the Othama (Pima Indian) population, treat the data as a population. (a) State the given Population values for the variable Age. (b) Then take four samples of size 30 and state the given Sample values for the variable Age. Sample 2 Sample 1 1= X = X = S Population N= 768 0 = 11.84 = 33-2 Shape= Sample 3 Sample 4 1= 11= X = X = S S= (c) Sketch the sampling distribution of the sample mean, and describe it in terms of S.C.S.O. You can see the shape by selecting Number of Samples to be 10000 instead of 4
Step by Step Solution
There are 3 Steps involved in it
1 Expert Approved Answer
Step: 1 Unlock

Question Has Been Solved by an Expert!
Get step-by-step solutions from verified subject matter experts
Step: 2 Unlock
Step: 3 Unlock