

Question: Example 5 Video Example 4) Graph the function below and state the domain and range. Solution We start with the graph of y = ex
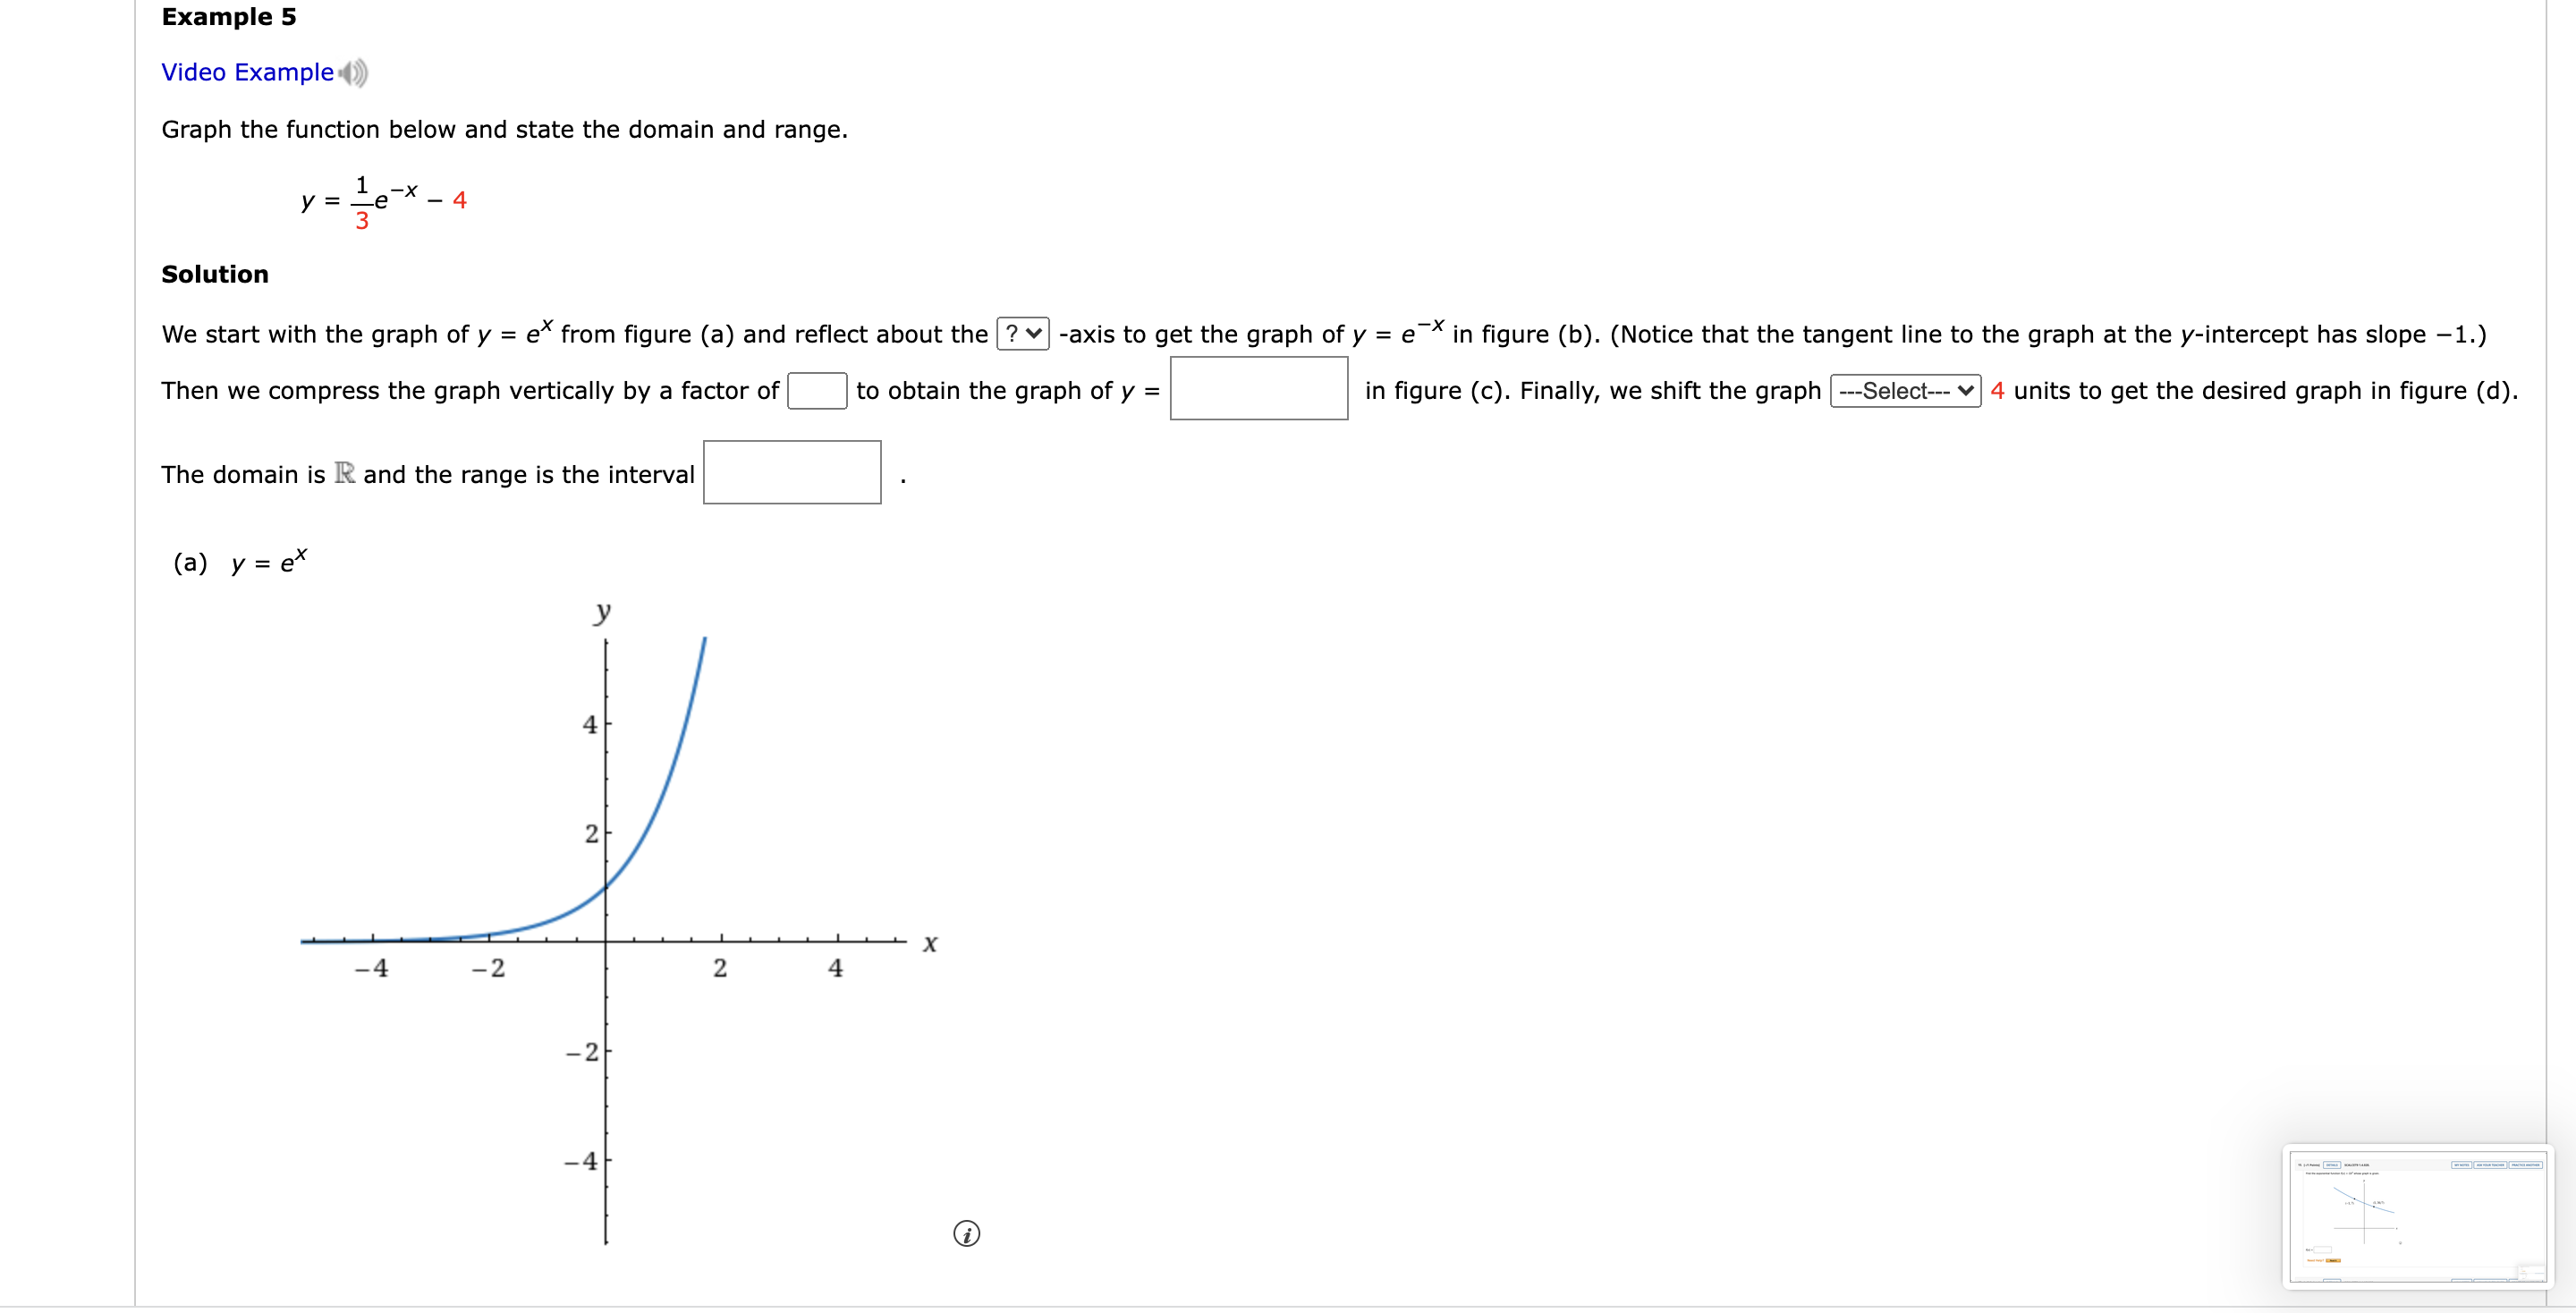
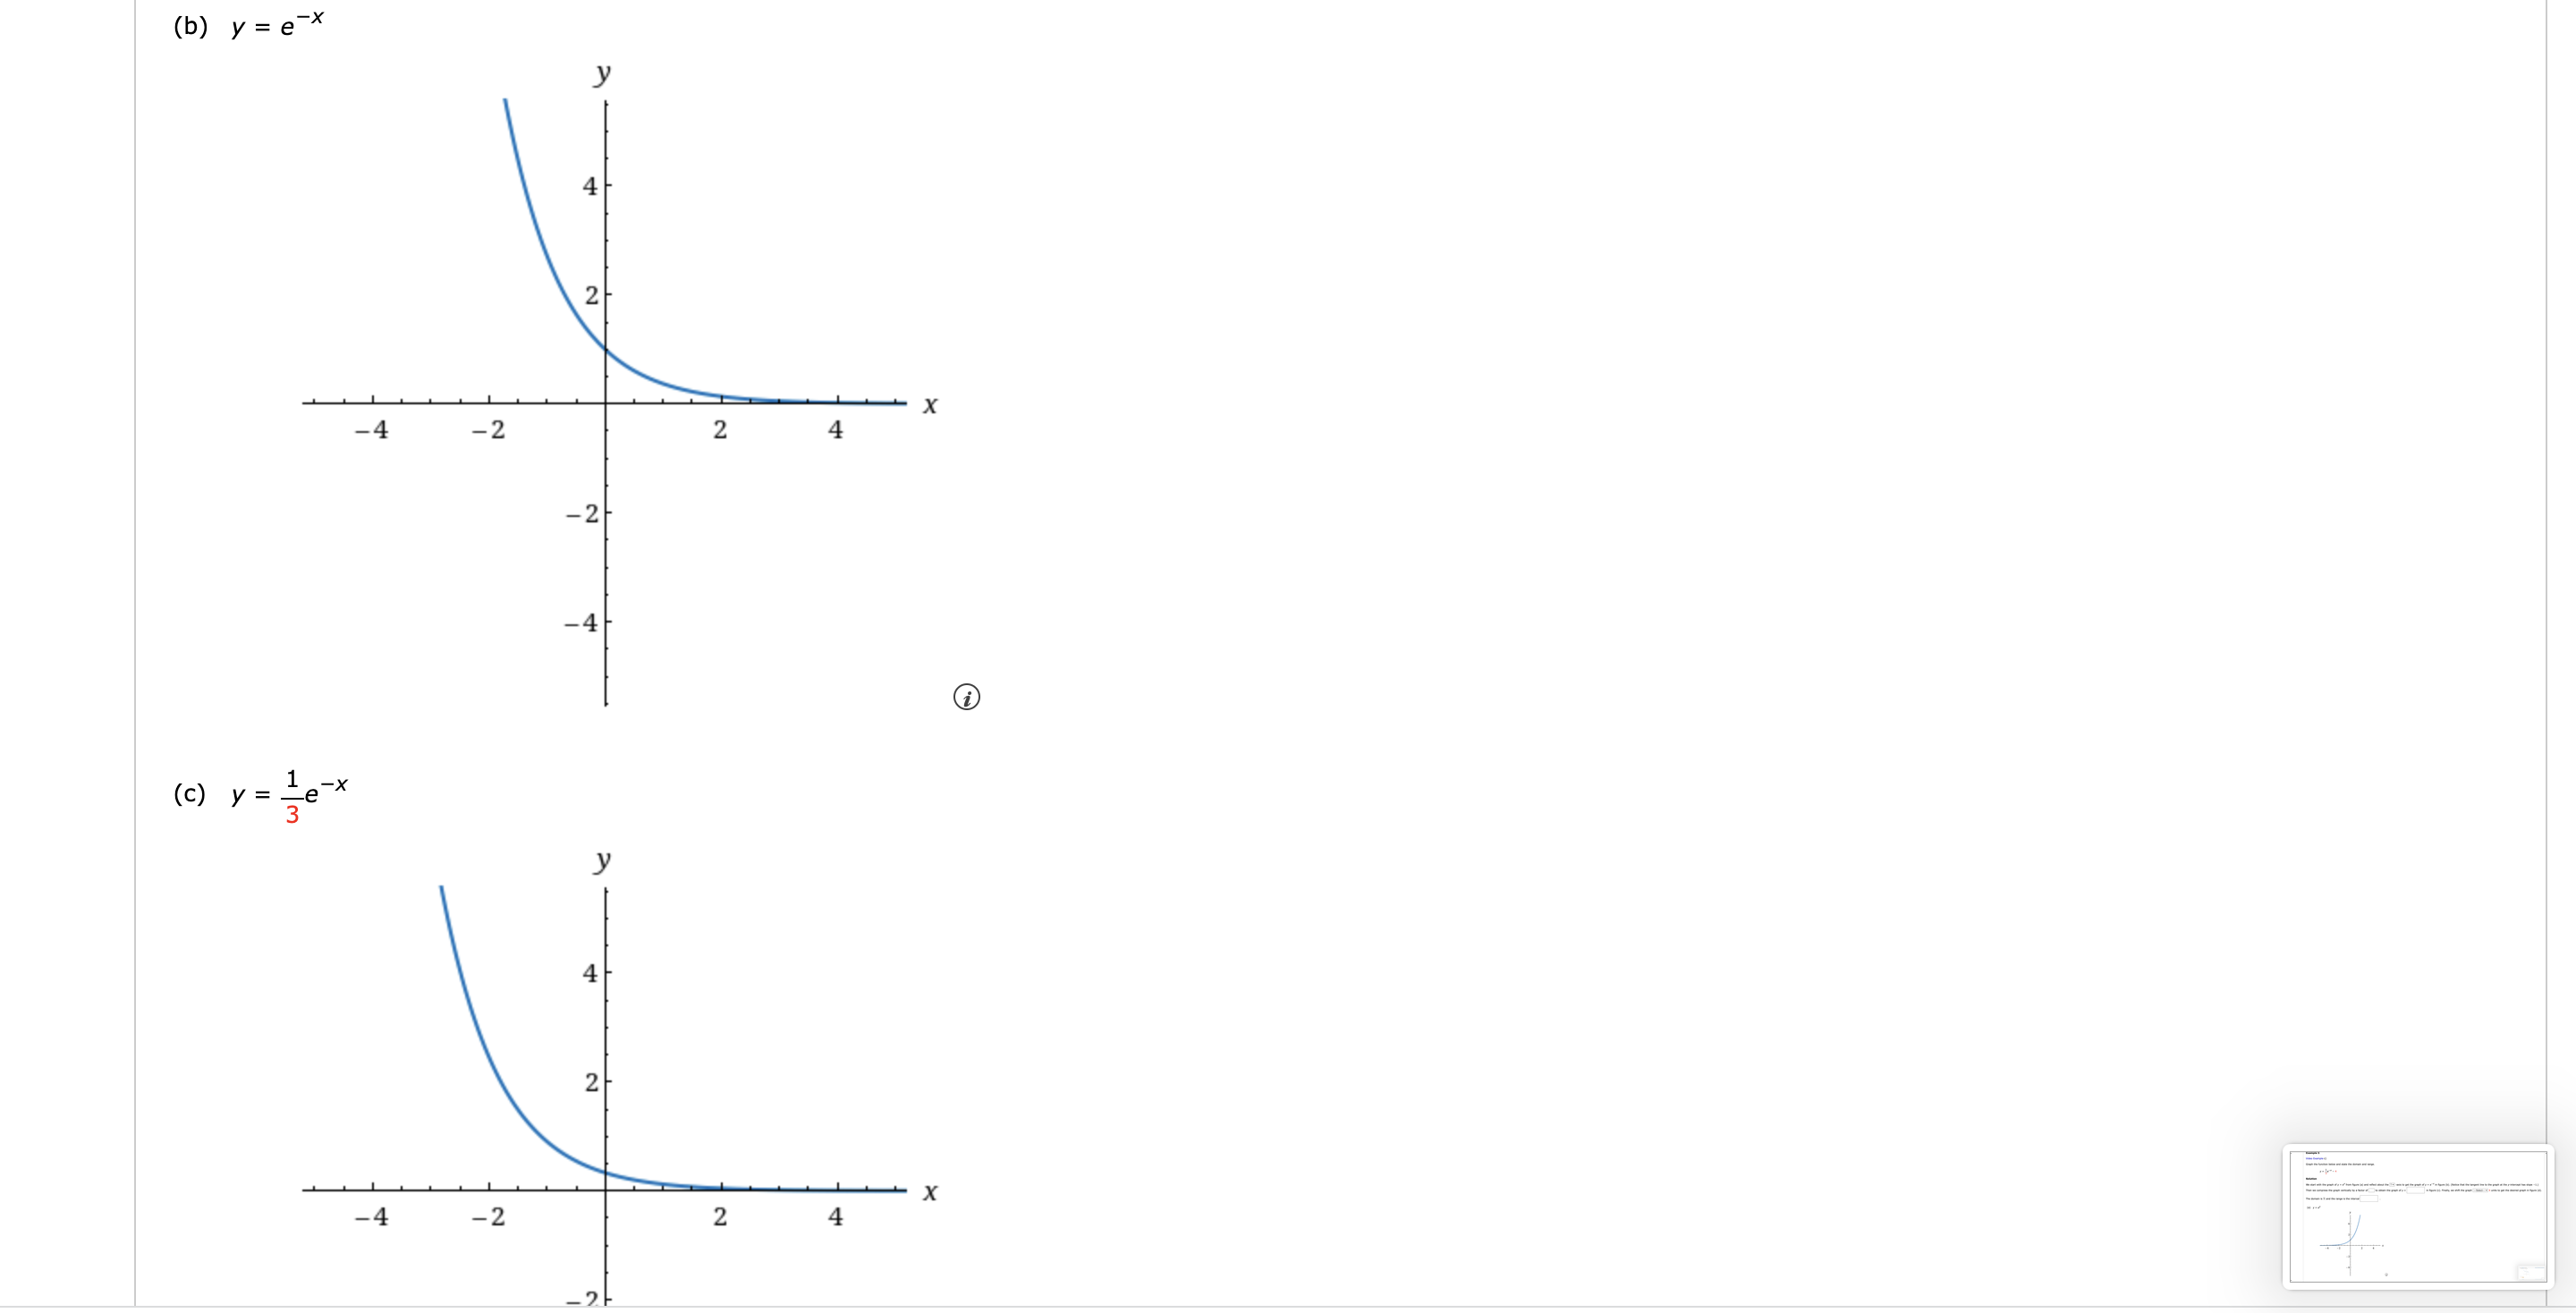
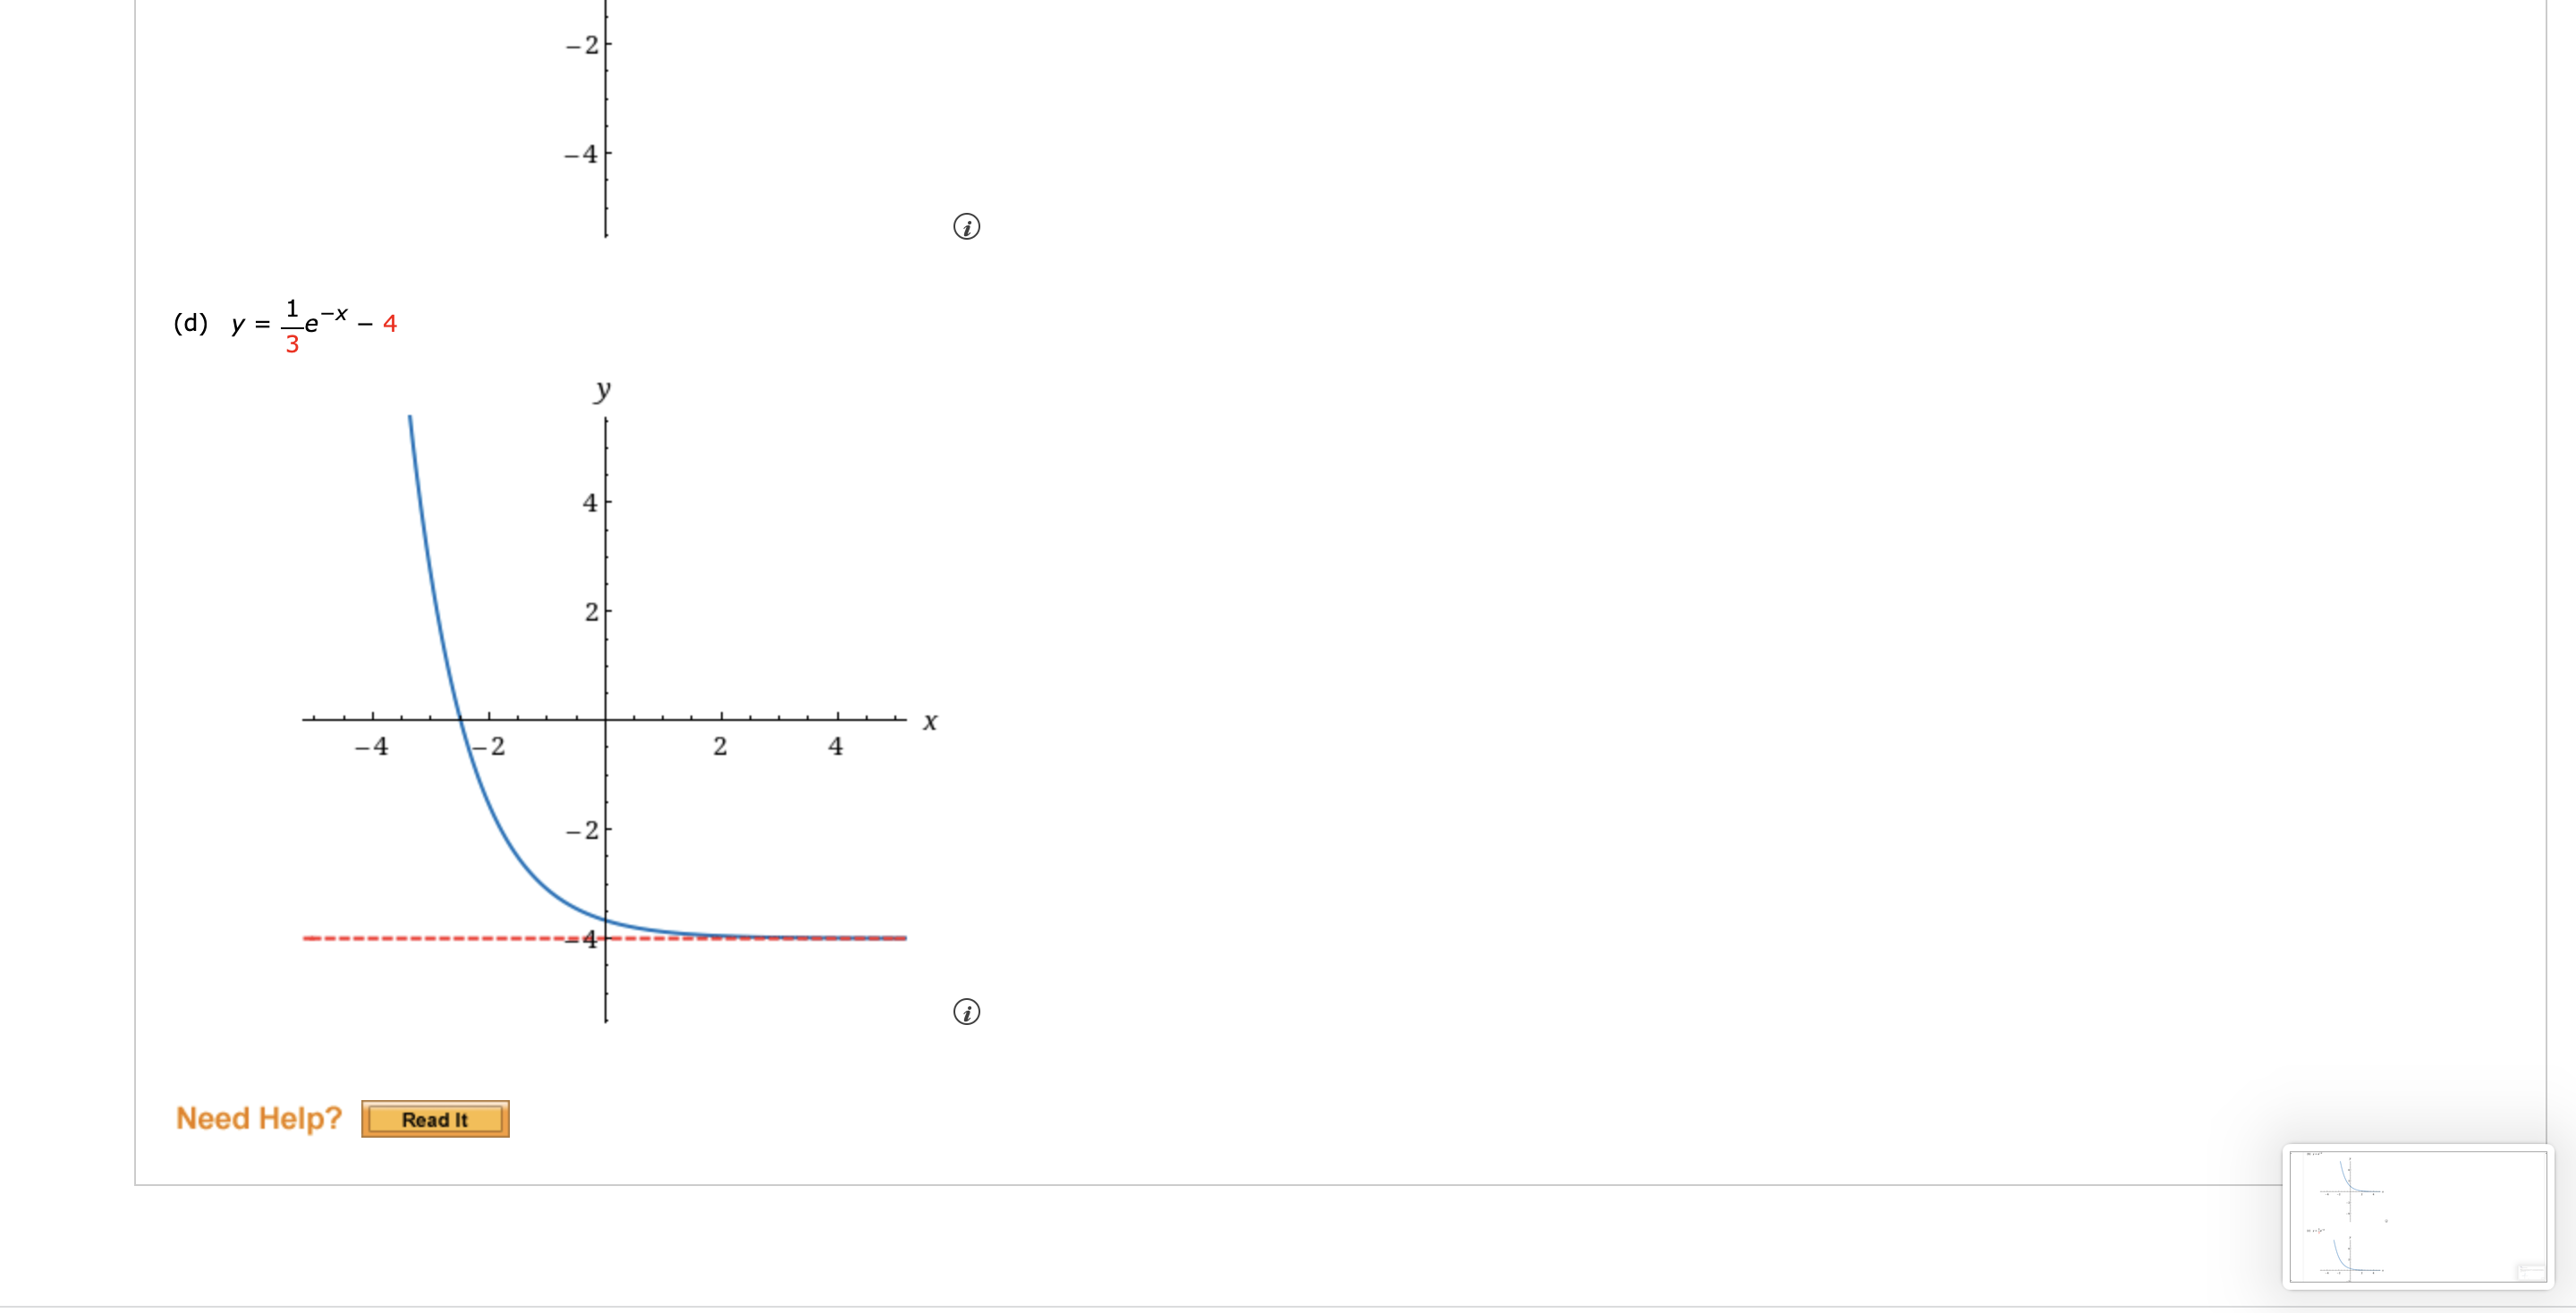
Example 5 Video Example 4) Graph the function below and state the domain and range. Solution We start with the graph of y = ex from figure (a) and reect about the Then we compress the graph vertically by a factor of to obtain the graph of y = The domain is R and the range is the interval (a) y=e* ? v -axis to get the graph of y = e" in gure (b). (Notice that the tangent line to the graph at the y-intercept has slope -1.) HSeIectv 4 units to get the desired graph in figure (d). in gure (c). Finally, we shift the graph (b ) y = ex 2 X -4 -2 2 4 -2 -4/ (c) y = _ex 4 2 X -4 -2 2 4-2 -4 (d) y = _ex - 4 4 2 -4 -2 X 2 4 -21 Need Help? Read It
Step by Step Solution
There are 3 Steps involved in it

Get step-by-step solutions from verified subject matter experts