

Question: Example 6 Assume that management makes the following estimates for a yearly period: Carrying cost per year Stock-out cost per unit $1 per unit
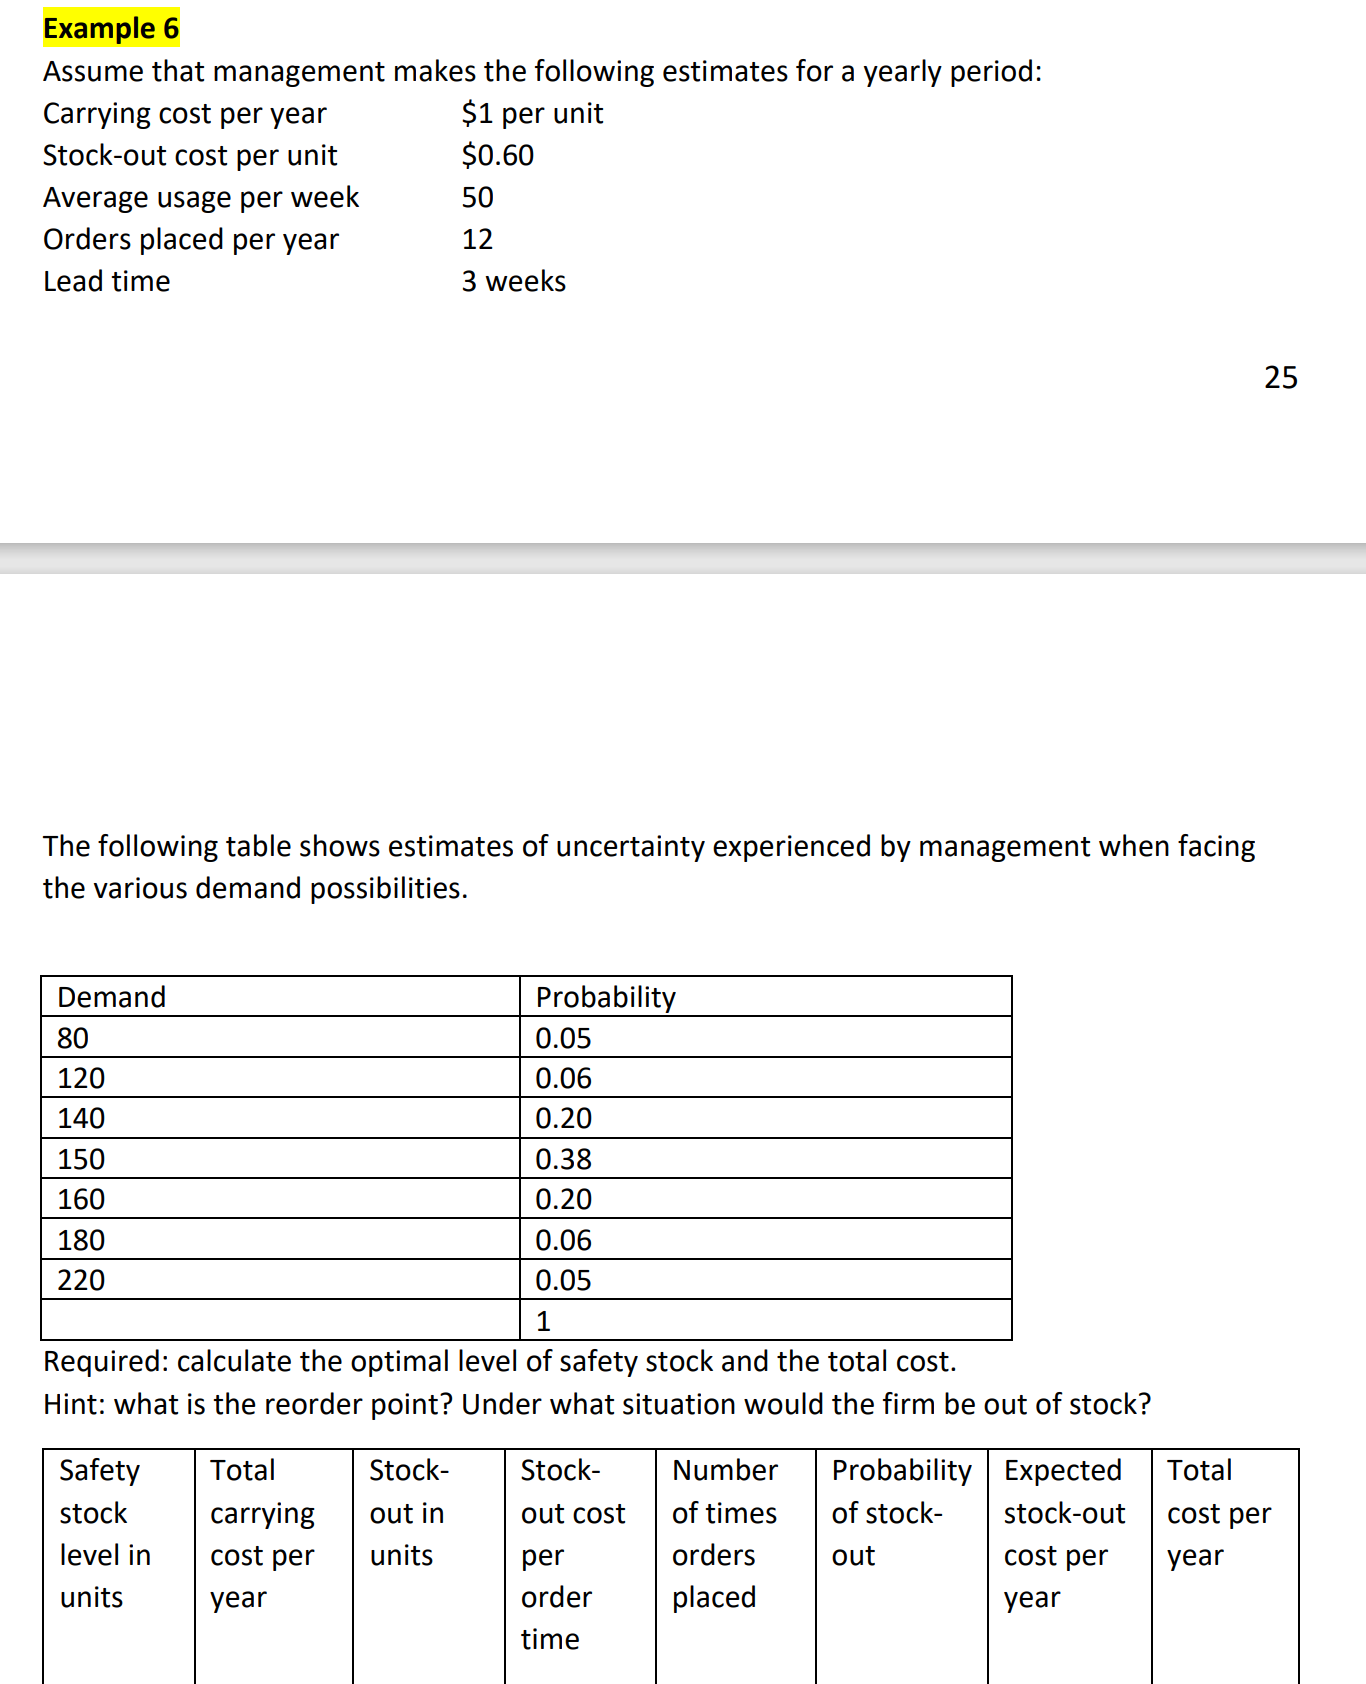
Example 6 Assume that management makes the following estimates for a yearly period: Carrying cost per year Stock-out cost per unit $1 per unit $0.60 50 Average usage per week Orders placed per year Lead time 12 3 weeks 25 25 The following table shows estimates of uncertainty experienced by management when facing the various demand possibilities. Demand 80 120 140 150 160 180 220 Probability 0.05 0.06 0.20 0.38 0.20 0.06 0.05 1 Required: calculate the optimal level of safety stock and the total cost. Hint: what is the reorder point? Under what situation would the firm be out of stock? Safety stock Total carrying Stock- out in level in cost per units units year Stock- out cost per order time Number of times orders placed Probability of stock- Expected stock-out Total cost per out cost per year year
Step by Step Solution
There are 3 Steps involved in it

Get step-by-step solutions from verified subject matter experts