

Question: Example 7 . 2 . Appendix Bcontains a listing of the peak discharges on the Cumberland River at Cumberland Falls. Kentucky. Beginning in 1 9
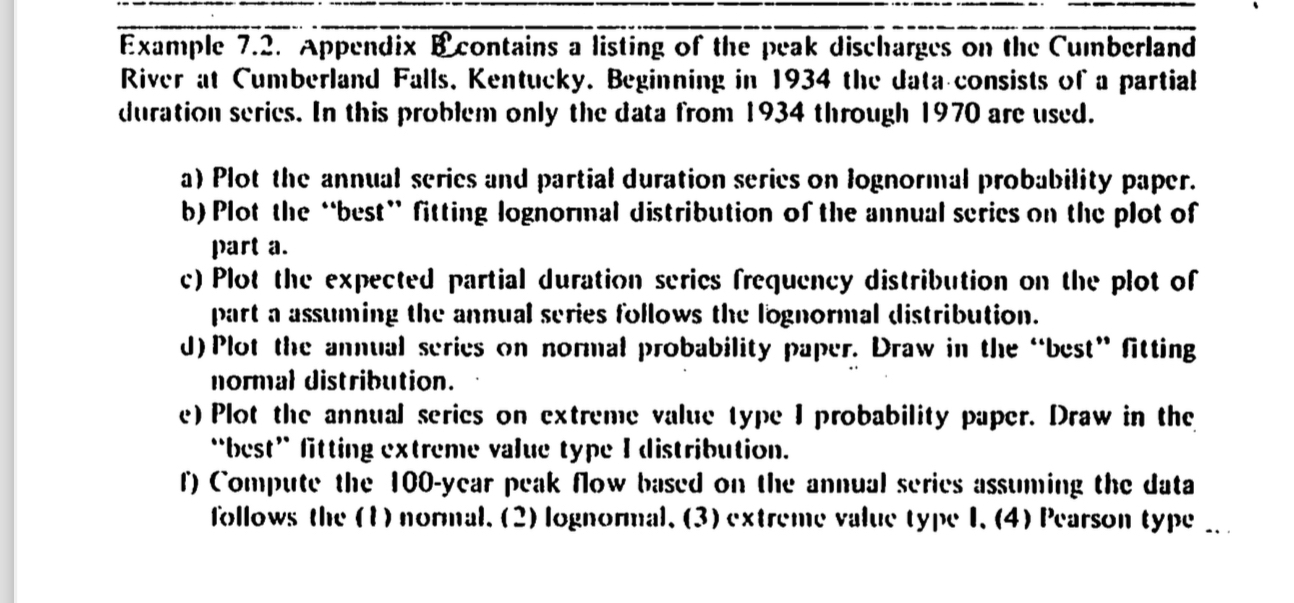
Example Appendix Bcontains a listing of the peak discharges on the Cumberland River at Cumberland Falls. Kentucky. Beginning in the data consists of a partial duration series. In this problem only the data from through are used.
a Plot the annual series and partial duration series on lognormal probability paper.
b Plot the "best" fitting lognormal distribution of the annual series on the plot of part a
c Plot the expected partial duration series frequency distribution on the plot of part a assuming the annual series follows the lognormal distribution.
d Plot the annual series on normal probability paper. Draw in the "best" fitting normal distribution.
e Plot the annual serics on extreme value type I probability paper. Draw in the "best" litting extreme value type I distribution.
i Compute the year peak flow based on the annual series assuming the data follows the nomial. lognormal extreme value type P'arson type
Step by Step Solution
There are 3 Steps involved in it
1 Expert Approved Answer
Step: 1 Unlock

Question Has Been Solved by an Expert!
Get step-by-step solutions from verified subject matter experts
Step: 2 Unlock
Step: 3 Unlock